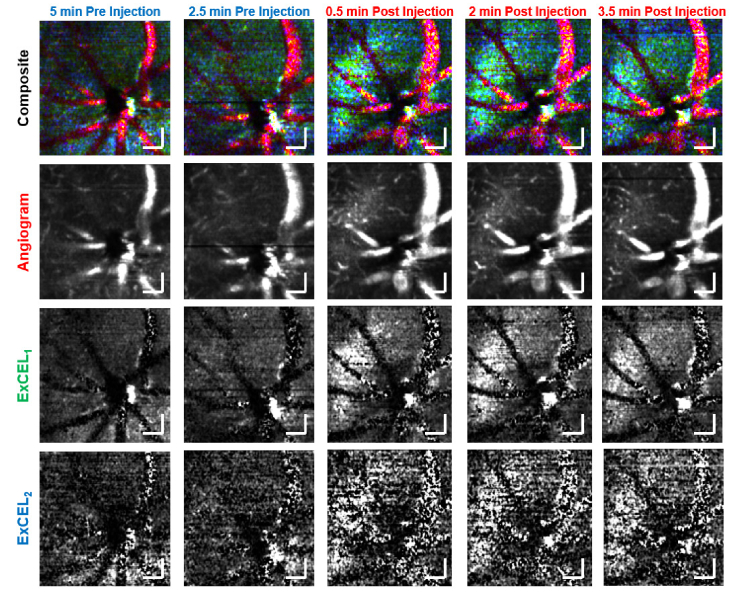
Fig. 4.
Individual frames from the automated movie processing used for blind leakage grading. These images form a time course of the leakage signal at the same position for 2 time points before and 3 time points after injection of the Intralipid tracer. A clear increase in leakage signal (cyan) is observed following injection. Individual color channels shown are below for the angiogram (red), ExCEL1 (green), and ExCEL2 (blue) signals. Scale bars are 100 µm.

