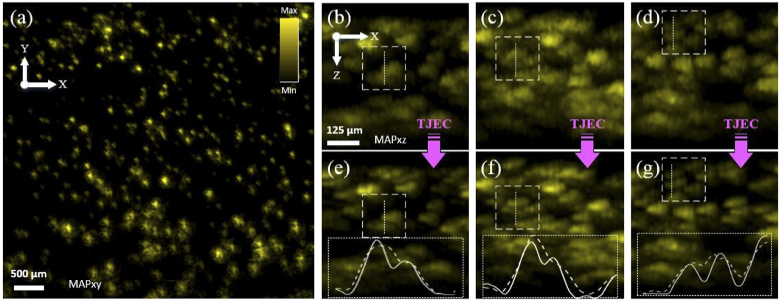
Fig. 5.
Effect of Laser Timing Jitter and Peak-Power Variation on System Axial Accuracy. (a) is the MAPxy image of the toner sample immobilized on a glass slide and imaged at an inclined angle. (b-d) are MAPxz images of the sample with TJ and (e-g) are the corresponding TJ corrected images. Dashed boxes in two image groups show the same locations before and after TJEC.

