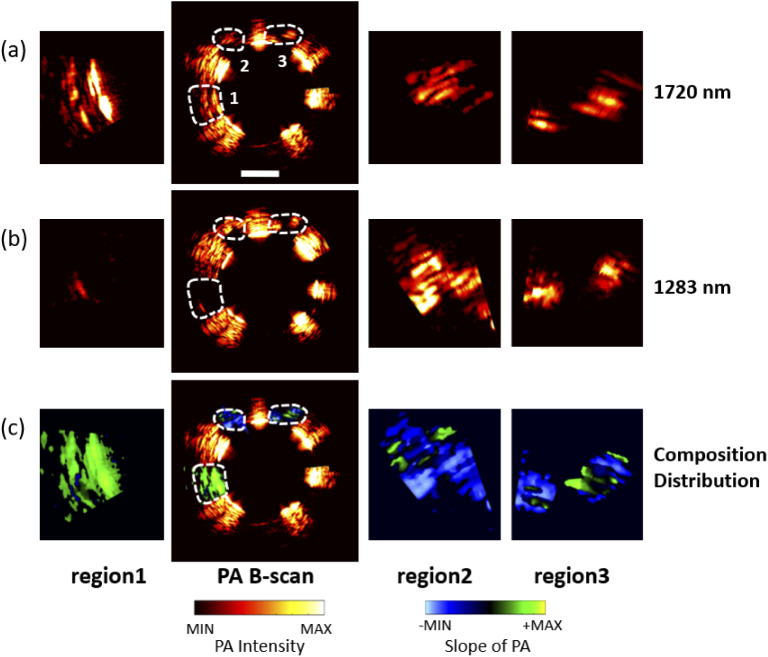
Fig. 4.
Adipose and tendon photoacoustic images at two wavelengths (1720nm and 1283 nm) and distribution analysis results. (a),(b) photoacoustic B-scan image at 1720nm and 1283 nm. Left: the enlarged image of the region 1; Center: B-scan image; Right: enlarged images of the region 2 and region 3. (c) The slope results of region1, 2, and 3. Left: enlarged view of the slope of region 1; Right: enlarged view of the slope of region 2,3; Center: the slope of region1, 2,3 remapping to the photoacoustic B-scan image. Scale bar: 1 mm

