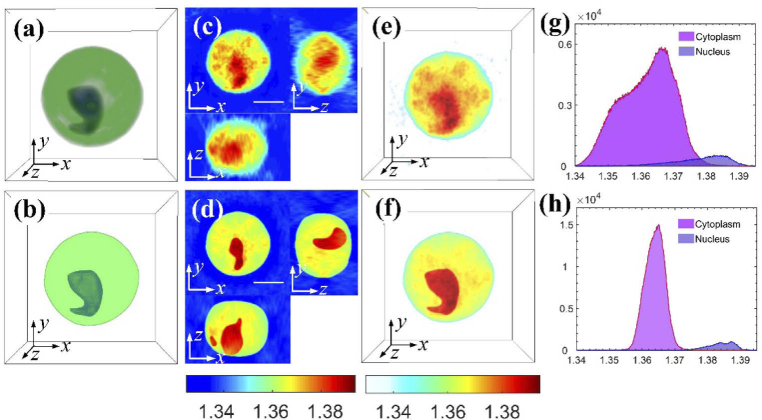
Fig. 6.
Comparative results of imaging a monocyte, which has distinctive difference in RI values between the cytoplasm and the nucleus. (a) Merged 3D fluorescence distribution of the cell obtained using SDCM (see Visualization 1 (1.3MB, avi) ). (b) Generated 3D masks from (a), in which the green colored mask represents the cytoplasm distribution and the blue colored mask represents the nucleus distribution (see Visualization 2 (1.3MB, avi) ). (c,e) Reconstructed RI results: (c) three cross-sectional slices, and (e) 3D RI distribution (see Visualization 3 (1.9MB, avi) ). Based on the RI value variance in different regions, both nucleus and cytoplasm values can be measured but they differ greatly from their true shapes. (d,f) The corresponding RI reconstructed with our method: (d) three cross-sectional slices, and (f) 3D RI distribution (see Visualization 4 (1.8MB, avi) ). In (d) and (f), the distributions of the nucleus and the cytoplasm are well matched with results measured by SDCM. (g) Histogram of RI values in the cytoplasm and the nucleus of the 3D RI map shown in (e). (h) Histogram of RI values in the cytoplasm and the nucleus of the 3D RI map shown in (f). Scale bars represent 5 μm.

