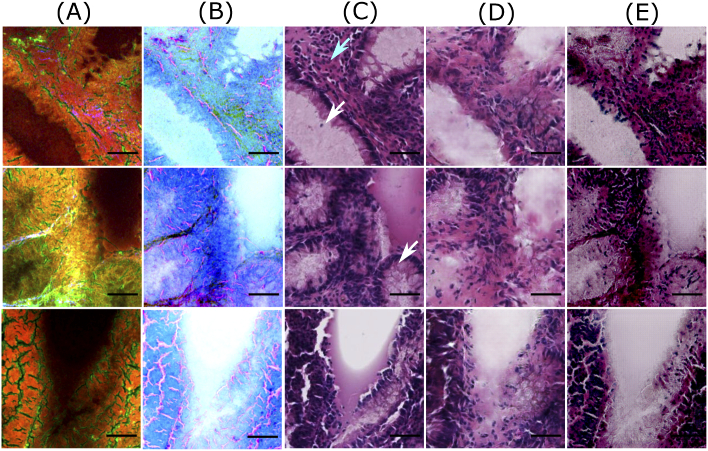
Fig. 3.
Good quality predictions of patches from the training dataset. Columns (A) and (B) visualize NLM patches and contrast inverted NLM patches, column (C) shows histopathologically stained H&E patch, and columns (D) and (E) visualize computationally stained H&E patch generated by the Pix2Pix model and the cycle CGAN model, respectively. The scale bar represents 50 m. For all patches in column C, the region within the crypts (pointed by white arrows) is light or pale pink, whereas the epithelial layer or mucosa region outlining the crypts appears dark purple. Similar colors with few variations are observed in the computationally stained H&E patches generated by the Pix2Pix (column D) and the cycle CGAN (column E) model. Also, the crypt structures are efficiently generated in the computationally stained H&E patches by both models. It is also observed that nucleus (pointed by cyan arrow) are not generated by the cycle CGAN model (column E).

