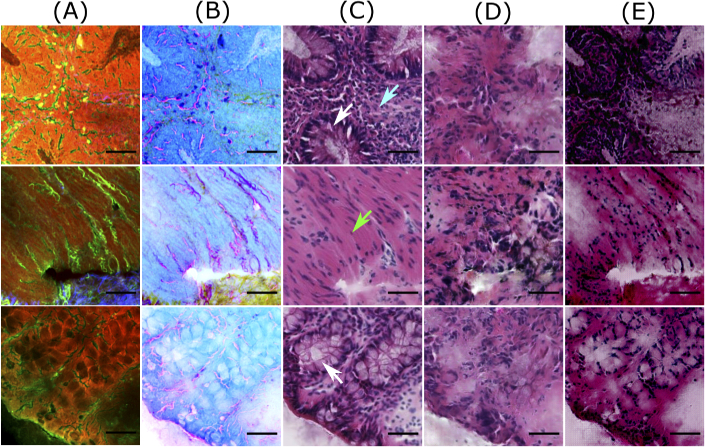
Fig. 4.
Bad quality predictions of patches from the training dataset. Columns (A) and (B) visualize NLM patches and contrast inverted NLM patches, column (C) shows histopathologically stained H&E patch, and columns (D) and (E) visualize computationally stained H&E patch generated by the Pix2Pix model and the cycle CGAN model, respectively. The scale bar represents 50 m. Here the patches generated by the cycle CGAN model show a promising translation of corresponding NLM patches; however, the colors in stroma regions (marked by green arrows) and nuclei signals (marked by cyan arrows) are not well represented. The computationally stained H&E patches generated by the Pix2Pix model have a low spatial resolution, as the structures within the crypts (pointed by white arrows) are not visible.

