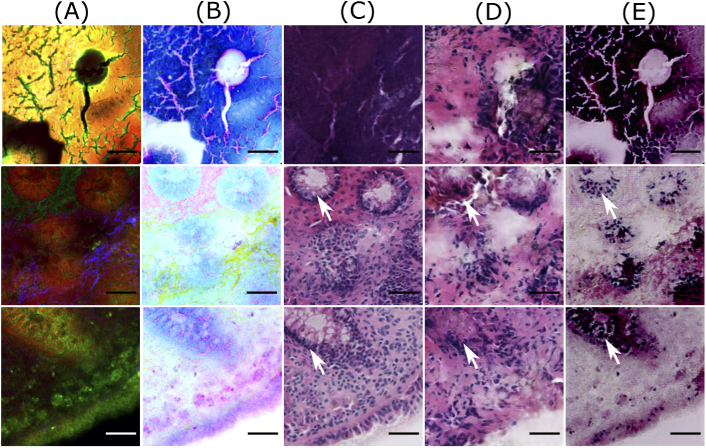
Fig. 6.
Bad quality predictions of patches from the test dataset. Column (A) shows NLM patches, column (B) visualizes contrast inverted NLM patches, column (C) shows histopathologically stained H&E patch, and columns (D) and (E) depict computationally stained H&E patch by the Pix2Pix model and the cycle CGAN model, respectively. The scale bar represents 50 m. Here, computationally stained H&E patches (columns D and E) are not similar to histopathologically stained H&E patches (column C), as histopathologically stained H&E patches show different structures than the corresponding NLM patch. Furthermore, in dark NLM patches (second and third row), the computationally stained H&E patches fail to generate appropriate color contrast in crypt regions (marked by white arrows).

