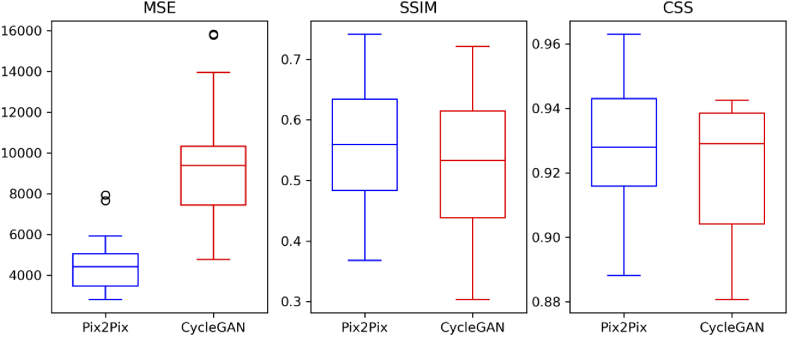
Fig. 7.
The boxplot shows a quantitative comparison of the Pix2Pix and the cycle CGAN model based on the three evaluation metrics. The MSE metric is higher for the cycle CGAN model and shows larger variation. This is expected as the pixel values of computationally stained H&E images generated by the cycle CGAN model differ more than the computationally stained H&E images generated by the Pix2Pix model. Nevertheless, the CSS and SSIM metric is in a similar range for both models, which implies that the content of computationally stained H&E images generated by both models is similar.

