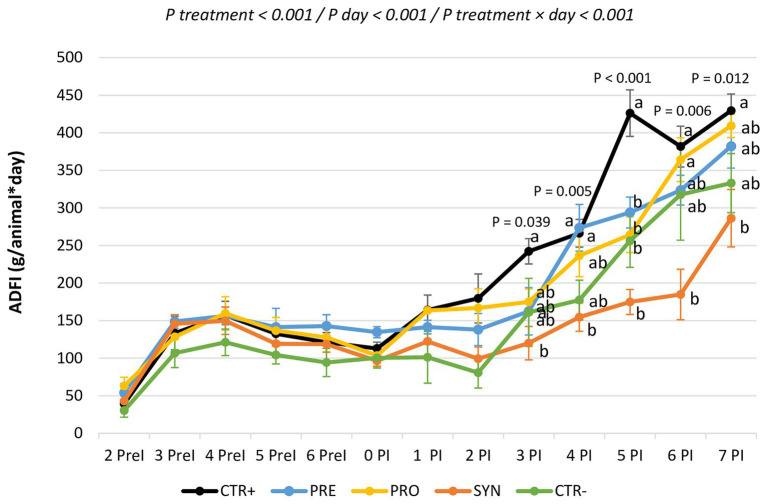
Figure 1.
Evolution of feed consumption for the experimental groups during the entire experimental period. CTR+: non-inoculated animals receiving placebo; PRO: inoculated animals receiving the probiotics; PRE: inoculated animals receiving the prebiotic; SYN−: inoculated animals receiving the synbiotic; CTR−: inoculated animals receiving placebo. N = 6 for all groups except for non-challenged animals (N = 8). a and b indicate statistically significant differences between groups. Bars correspond to the standard error. ADFI, average daily feed intake; PreI, pre-inoculation; PI, post-inoculation.

