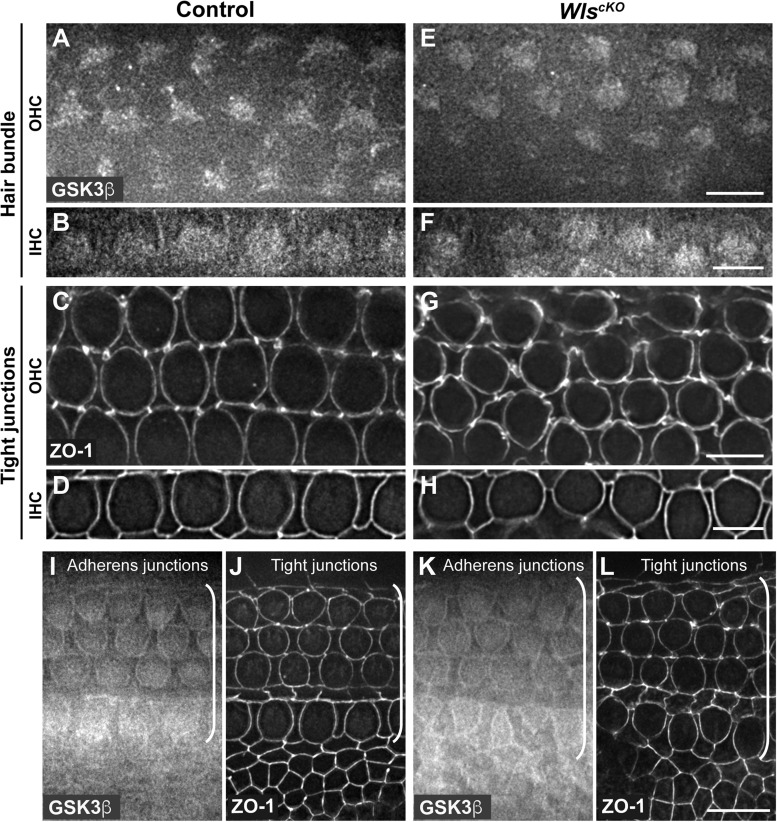
FIGURE 2.
Similar Gsk3β localizations in control and WlscKO cochleae. (A–H) Gsk3β staining at the level of hair bundle and ZO-1 staining at the level of tight junctions in control (A–D) and WlscKO (E–H) OC at E18.5. (I–L) Gsk3β staining at the level of adherens junctions and ZO-1 staining at the level of tight junctions in control (I,J) and WlscKO (K,L) OC and surrounding regions. Brackets indicate the OC. Lateral is up. Scale bars: (A–L), 6 μm; (M–P), 10 μm.

