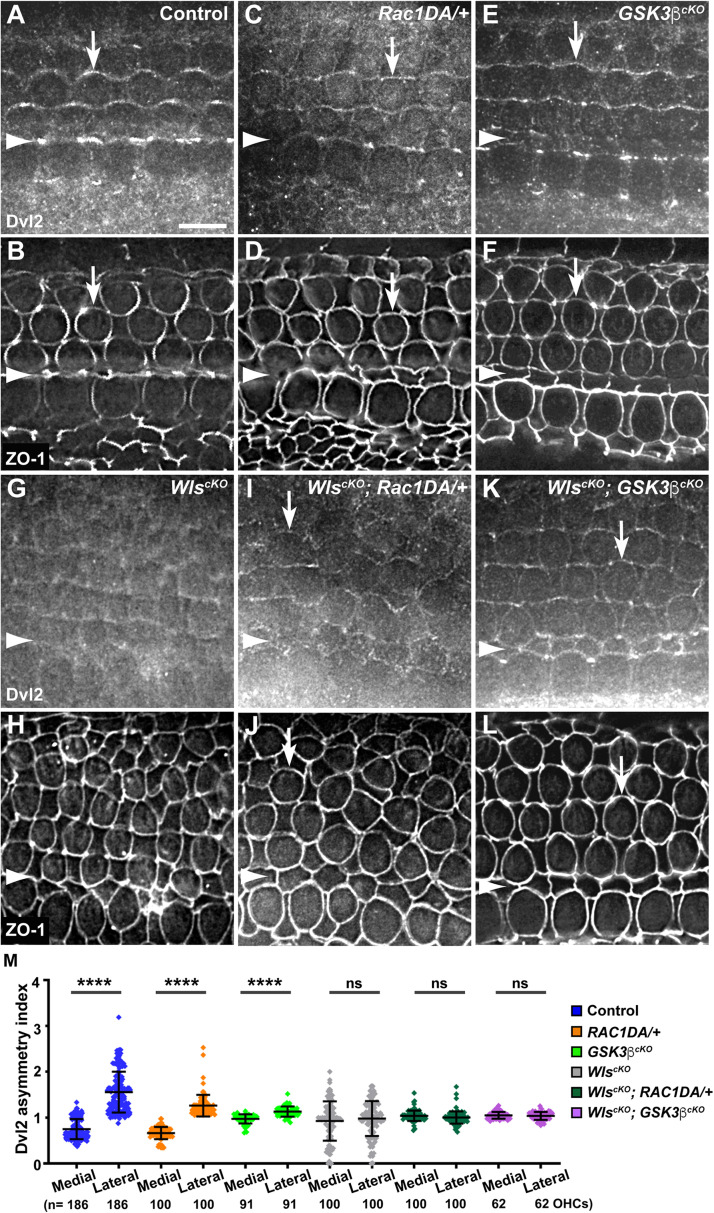
FIGURE 6.
Effects of Rac1 activation and Gsk3β inactivation on Dvl2 localization in Wls-deficient OC. (A–L) Flat-mounted E18.5 wild-type control (A,B), Rac1DA/+ (C,D), Gsk3βcKO (E,F), WlscKO (G,H), WlscKO; Rac1DA/+ (I,J), and WlscKO; Gsk3βcKO (K,L) OC stained for Dvl2 and ZO-1 as indicated. Arrows indicate Dvl2 crescents along the lateral borders of OHCs. Arrowheads indicate the inner pillar cell row. Lateral is up. Scale bar: 6 μm. (M) Quantifications of Dvl2 staining along the medial and lateral junctions of OHCs. Numbers of OHCs scored are indicated on the bottom. Color keys for genotypes are indicated on the right. Ns, not significant.

