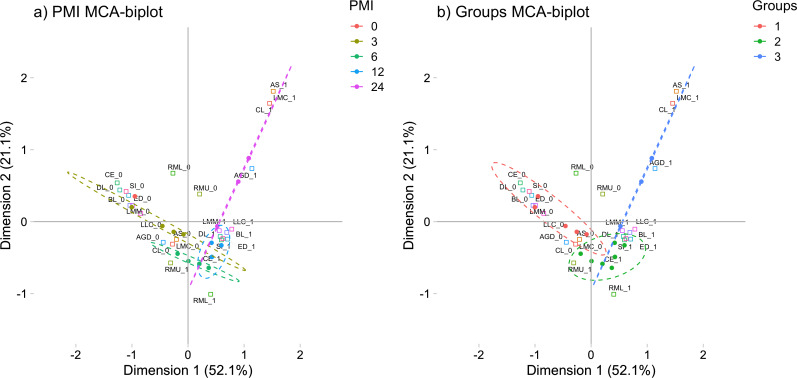
Figure 1. Multiple correspondence analysis (MCA) between the early post-mortem interval and the presence of morphological changes in rats.
(A) MCA of the analyzed PMIs (0, 3, 6, 12 and 24 h) and the presence of internal and external morphological changes. (B) MCA of the PMIs groups I (0 and 3 h), II (6 and 12 h) and III (24 h), and the presence of internal and external morphological changes. Both plots represented the greatest cumulative variability and could capture at least the 74.2 % of the data. Abbreviations of the morphological characteristics are shown in Table 1. Dots represent each rat, while squares are the dichotomic presence of morphological changes (0: absence, 1: presence). The dashed line ellipses shown the distribution of the rats throughout the PMI.

