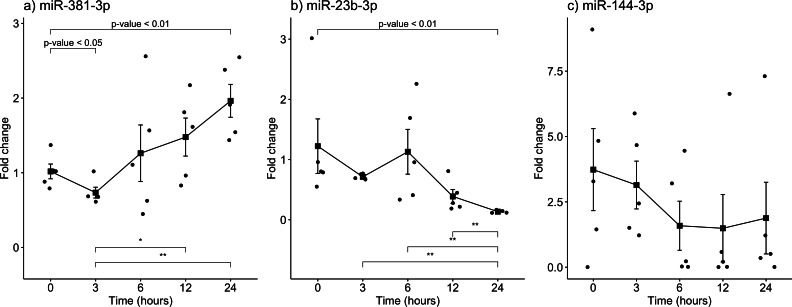
Figure 2. Gene expression analysis of miRNAs miR-381-3p, miR-23b-3p and miR-144-3p in rat skeletal muscle throughout the early different post-mortem interval.
The Fold-Change (FC) of miRNAs (A). miR-381-3p (B). miR-23b-3p and (C). miR-144-3p was analyzed in rats skeletal muscle at 0, 3, 6, 12 and 24 hours of PMI using quantitative RT-qPCR. The Fold Change of each miRNA was calculated with the 2−ΔΔCT method using miR-361-5p as internal control. The black squares represent the mean of the FC from each group, the whisker corresponds to the 95% confidence interval and the dots are the jittered FC of each sample. Comparisons between the PMI were done with the Mann U-Whitney test. * p-value < 0.05, ** p-value < 0.01.

