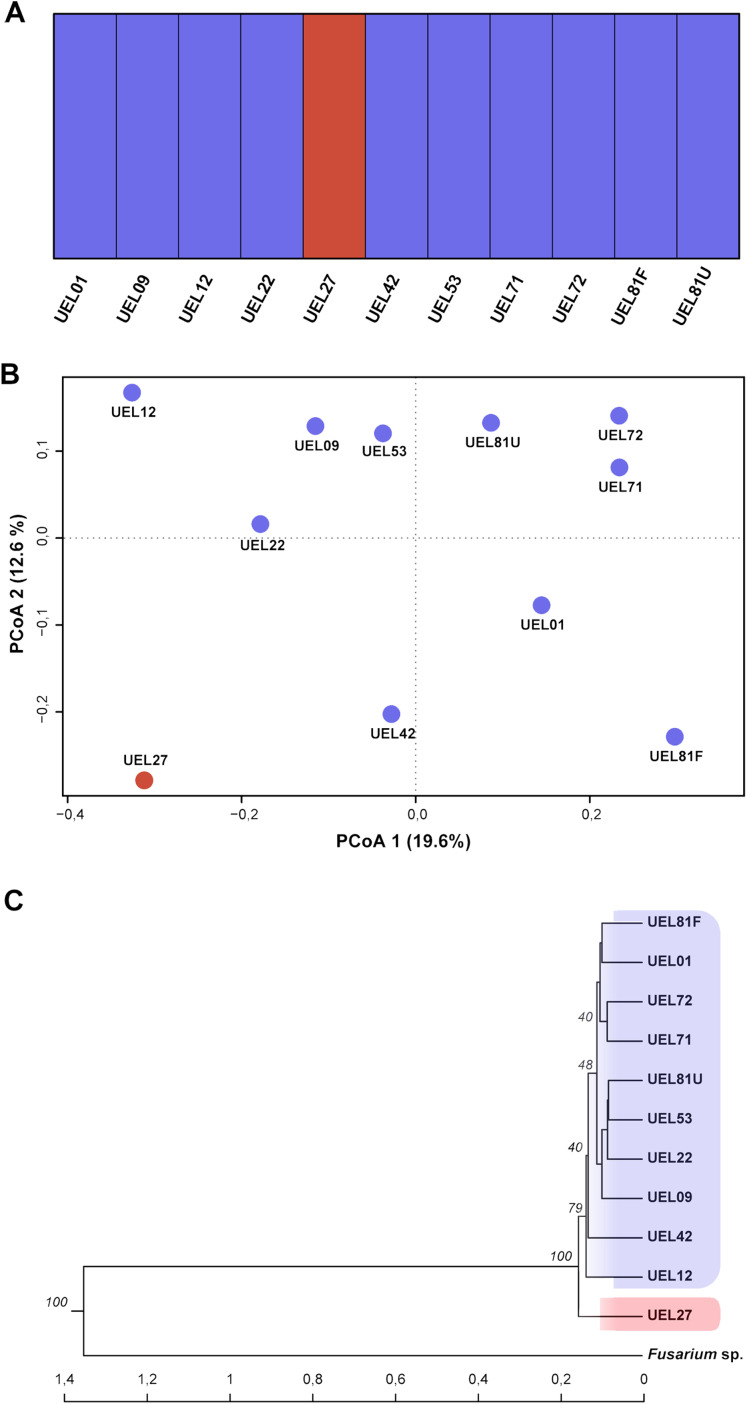
Figure 4. Cluster analysis based on 694 AFLP fragments showing the variability contained in the 11 Colletotrichum scovillei isolates.
(A) Clusters formed by Bayesian genetic clustering analysis performed in BAPS; (B) Principal Coordinate Analysis (PCoA). (C) Dendrogram generated by UPGMA hierarchical clustering (sample Fusarium sp. was used as the outgroup to root the dendrogram).

