FIGURE 6.
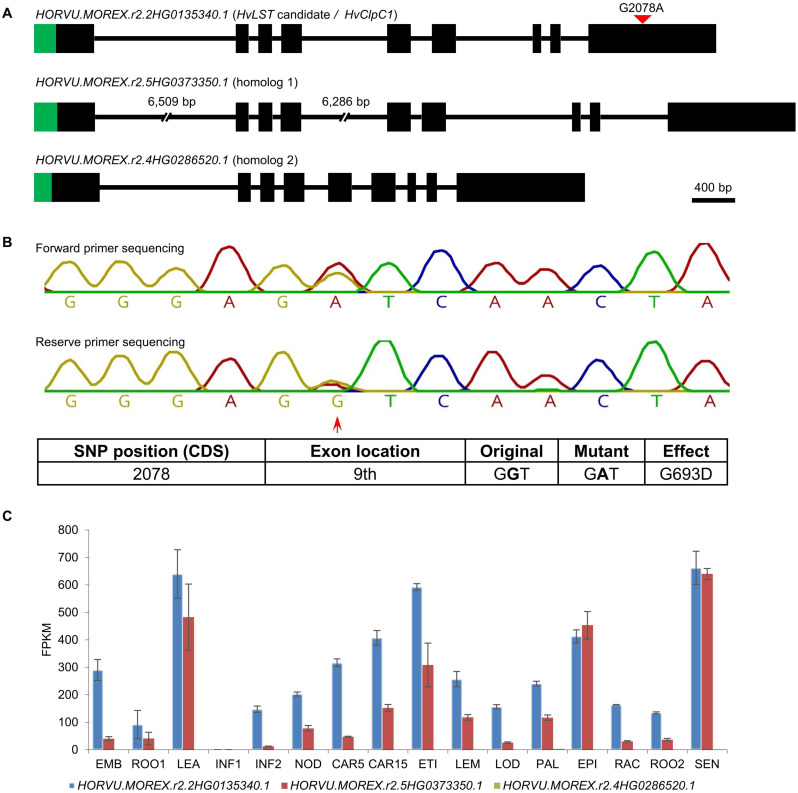
Validation of the heterozygous SNP of HvClpC1 by Sanger sequencing and expression profiles of HvClpC1 and homologs. (A) Gene structure of HvLST candidate (HvClpC1) and its two closest homologs. Black boxes indicate exons and horizontal lines indicate introns. Green areas indicate chloroplast transit peptides as predicted by ChloroP (Emanuelsson et al., 1999). The first and second introns of homolog 1 are not drawn at scale as indicated by the interrupted lines; the actual length is shown above gaps, respectively. Red filled triangle indicates SNP position of HvClpC1. (B) Chromatogram of Sanger sequencing. Red arrow indicates position of the heterozygous SNP of HvClpC1 in the original mutant line luteostrians-P1_1. Details of the SNP are illustrated in the table below. (C) Expression profiles of HvClpC1 and its two closest homologs. The expression levels are given as fragments per kilobase of exon per million reads mapped (FPKM) across sixteen different tissues or developmental stages. The data was taken from Mascher et al. (2017). EMB, 4-day embryos; ROO1, roots from seedlings (10 cm shoot stage); LEA, shoots from seedlings (10 cm shoot stage); INF1, young developing inflorescences (5 mm); INF2, developing inflorescences (1-1.5 cm); NOD, developing tillers, 3rd internode (42 DAP); CAR5, developing grain (5 DAP); CAR15, developing grain (15 DAP); ETI, etiolated seedling, dark condition (10 DAP); LEM, inflorescences, lemma (42 DAP); LOD, inflorescences, lodicule (42 DAP); PAL, dissected inflorescences, palea (42 DAP); EPI, epidermal strips (28 DAP); RAC, inflorescences, rachis (35 DAP); ROO2, roots (28 DAP); SEN, senescing leaves (56 DAP).

