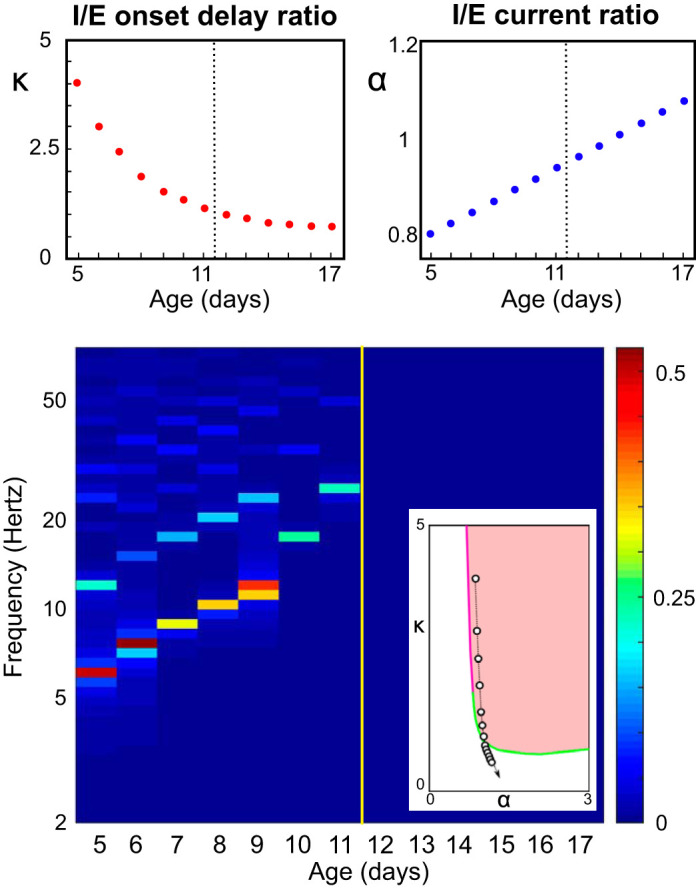
Fig. 5.

Model of the developmental switch. Top: proposed developmental trajectories for relative [inhibitory (I)/excitatory(E)] inhibitory onset delay κ and amplitude α. The black dashed vertical lines indicate the moment of the development switch, happening between postnatal day (P)11 and P12. Bottom: spectrogram of the solutions of Eq. 6 with external input IE = 1.5 and excitatory synaptic rise time constant = 5 ms, computed as the fast Fourier transform of the excitatory activity uE; same calculation and representation as used in the experimental data of Fig. 1A. Inset: the chosen trajectory in the bifurcation diagram in the 2-dimensional parameter space (α,κ). Color codes as in Fig. 3 and Fig. B2.
