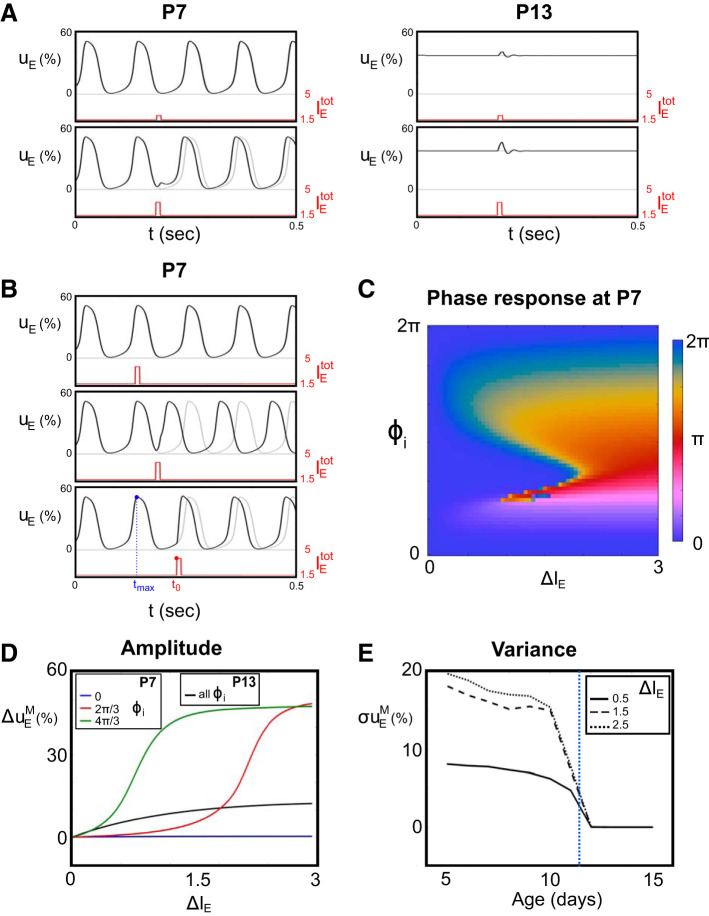
Fig. 7.
Response to external input transients. We consider the response of the excitatory population when a 10-ms square input is applied to both excitatory and inhibitory populations. A: results corresponding to postnatal day (P)7 (left) and P13 (right), where model parameters are fixed as in Fig. 2 and Fig. 5, in the absence of noise, for 2 different external stimuli, ΔIE = 0.5 (top) and ΔIE = 1.5 (bottom). Solid black lines represent excitatory activity uE when an external input transient is applied (red solid lines), and dotted lines are the corresponding activity for baseline constant input. B: responses at P7 for different onset time t0 of the transient external stimuli, relative to the instant of previous maximum of activity tmax. C: the color map represents the asymptotic phase shift Φt between the excitatory activity response and the unperturbed solution, as a function of the transient amplitude ΔIE and the initial phase shift ϕi. D: maximum difference Δ in activity between perturbed and unperturbed dynamics, for different initial phase shift ϕi, in a window of 100 ms from the onset time of the external impulse (P7 and P13 model parameters). E: variance σ of the distribution over ϕi as a function of the age of the animal (parameters fixed as in Fig. 5) for different values of ΔIE. The blue dashed vertical line indicates the moment of the developmental switch, happening between P11 and P12.

