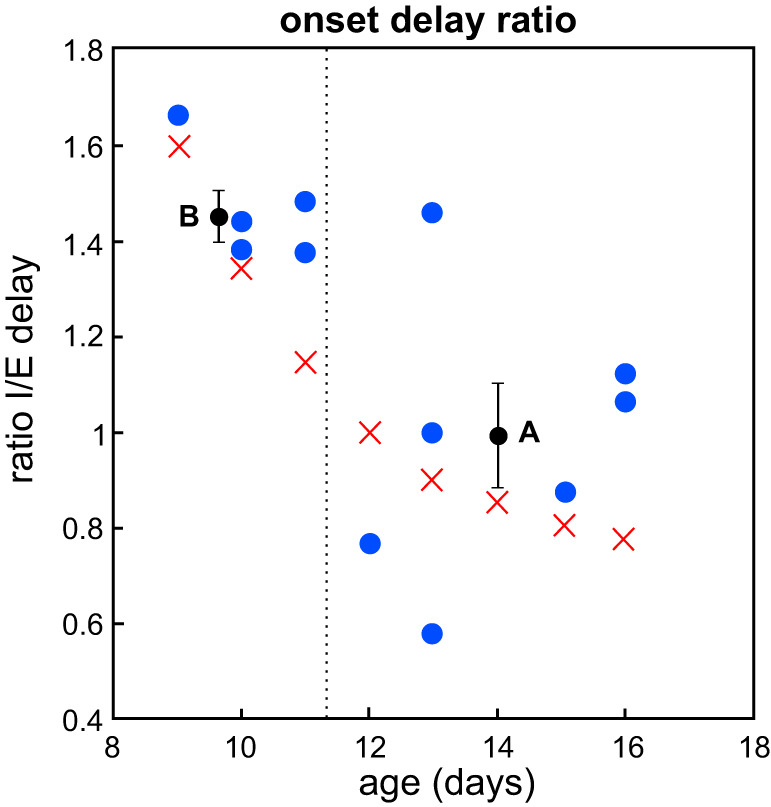
Fig. 8.

Decreasing ratio of delays. Blue points represent the experimental data of Fig. 1C expressed in terms of ratio between inhibitory and excitatory current onset (I/E) delays. The dashed line indicates the moment of the observed developmental switch, between postnatal day (P)11 and P12. Black points and error bars represent the mean values and standard error for the points before (B) and after (A) the transition. Red crosses correspond to the trajectory for onset delay κ chosen in the example of Fig. 5.
