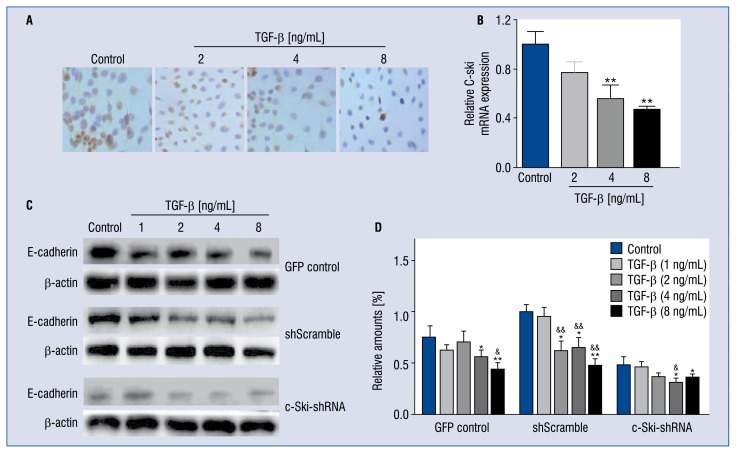
Figure 5.
Effect of TGF-β1 on c-Ski expression and c-Ski-shRNA on E-cadherin expression in H9C2 cells. Immunocytochemical analysis (A) and RT-qPCR assay (B) for the protein and mRNA expression of c-Ski with TGF-β1 stimulation. C. Effect of c-Ski-shRNA on E-cadherin expression under different concentrations of TGF-β1 stimulation; D. The quantification of the gray scale of the bands in different treated groups by software ImageJ; *p < 0.05, **p < 0.01, compared with the GFP control; &p < 0.05, &&p < 0.01, compared with the non-TGF-β1-treated group.

