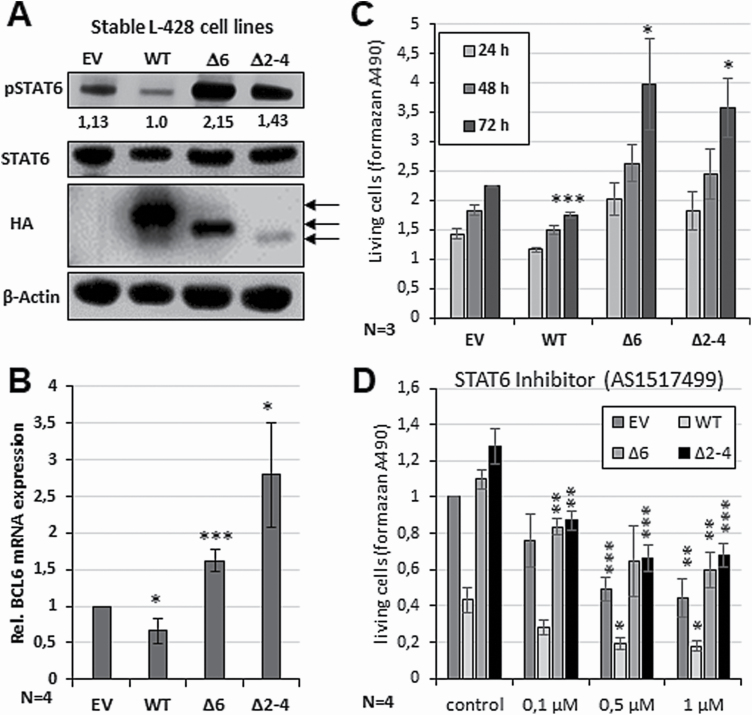
Figure 4.
Impact of PTP1B∆ variants on the proliferation and survival of the cHL cell line L-428. (A) Immunoblot analysis of WCE of L-428 cells stably transfected with either pcDNA3.1 (EV) or HA-PTP1BWT, HA-PTP1B∆6 or HA-PTP1B∆2–4. Antibodies against pSTAT6, HA and β-actin are used. Numbers indicate relative pSTAT6 levels normalized against β-actin value (Supplemental Figure 3B). (B) Altered BCL6 mRNA expression levels of the L-428 cells stably transfected with the PTP1BWT, PTP1B∆6 or PTP1B∆2–4 determined by sqPCR analysis. Measurements were performed in triplicates and the mean of four independent experiments and standard error of mean (SEM) are depicted. Comparisons were performed between EV measurement and individual stable cell line. Significances are calculated using Student’s t-test (P < 0.05 was regarded as significant). (C) Altered proliferation of the L-428 cells stably transfected with the PTP1BWT, PTP1B∆6, PTP1B∆2–4 variant or EV control over time (24, 48 and 72 h). Mean of three independent MTS assay measurements and SEM are depicted. Comparisons were performed between control measurement and individual stable cell line. Significances are calculated using Student’s t-test (P < 0.05 was regarded as significant). (D) Altered proliferation of the L-428 cells stably transfected with the PTP1BWT, PTP1B∆6, PTP1B∆2–4 variant or EV control and incubated with the indicated amounts of the STAT6 inhibitor AS1517499 for 72 h. Mean of four independent MTS assay measurements and SEM are depicted. Comparisons were performed between control measurement and individual stable cell line. Significances are calculated using Student’s t-test (P < 0.05 was regarded as significant).

