. 2021 Apr 30;129(4):047014. doi: 10.1289/EHP7722

Figure 3.

Figure 3A is a line graph plotting predicted rat oral lethal dose, 50 percent (moles per kilogram), ranging from 10 begin superscript negative 10 end superscript to 10 begin superscript 3 end superscript in unit increments (y-axis) across chemical rank by lethal dose, 50 percent, ranging from 0 to 15,000 in increments of 1,000 (x-axis) for lethal dose, 50 percent and 90 percent confidence intervals. Figure 3B is a bubble polar area chart and line graph, and a pie chart. The bubble polar area chart and line graph plotting Toxicological Priority Index, ranging from 0.0 to 1.0 in increments of 0.2 (y-axis) across chemical rank by Toxicological Priority Index score, ranging from 0 to 8,000 in increments of 2,000 (x-axis) for Toxicological Priority Index and 95 percent confidence intervals. The pie chart is divided into sixteen parts, namely, androgen underscore efficacy, androgen, estrogen underscore efficacy, estrogen, bioconcentration factor, the octanol-water partitioning coefficient, other nuclear receptor underscore efficacy, other nuclear receptor underscore, monoamine efficacy, Monoamine, peroxisome proliferator-activated receptors underscore efficacy, peroxisome proliferator-activated receptors, Glucocorticoid underscore efficacy, Glucocorticoid, Thyroid underscore efficacy, and thyroid. Figure 3C is a line graph plotting predicted exposure (milligrams per kilogram body weight per day), ranging from 10 superscript negative 18 to 10 superscript 6 in increments of 10 superscript 4 (y-axis) across chemical rank by exposure, ranging from 0 to 16,000 in increments of 2,000 (x-axis) for exposure and 95 percent confidence intervals.

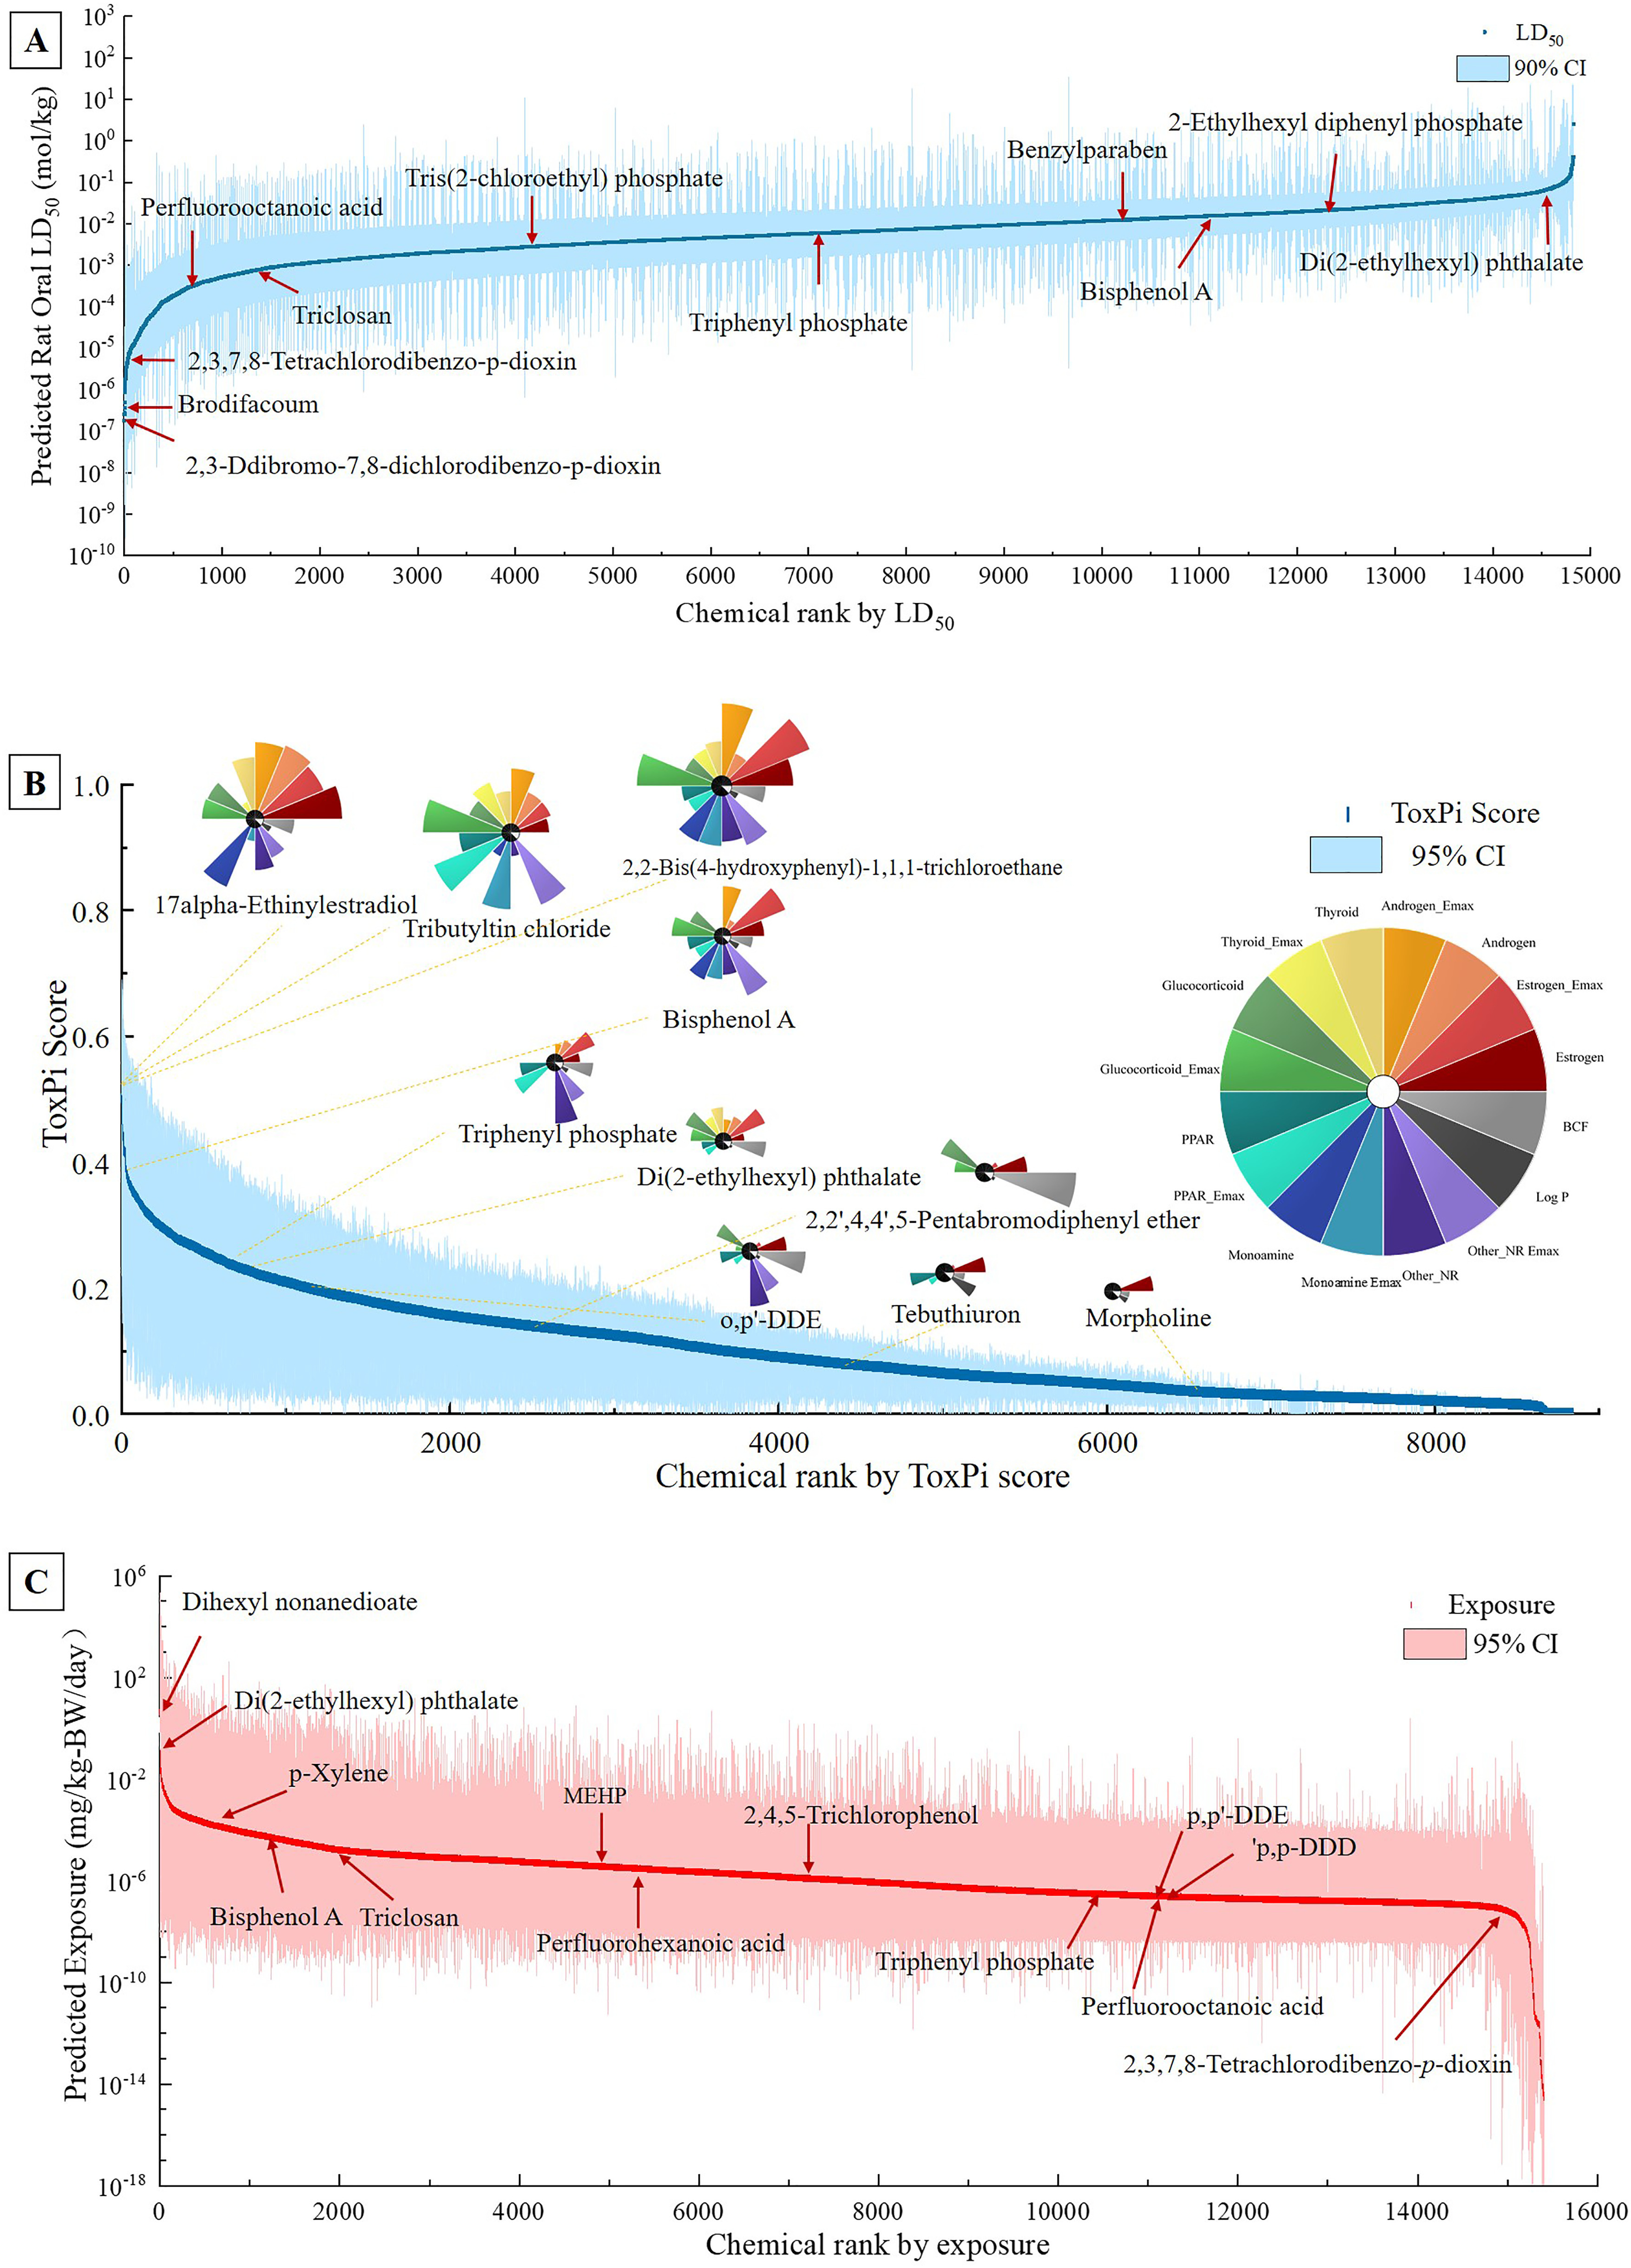
The cumulative distribution of (A) predicted rat oral LD50 (n=14,827); (B) Toxicological Priority Index (ToxPi) score (n=8,845); (C) Systematic Empirical Evaluation of Model (SEEM) predicted exposure values (n=15,408). Some typical environmental pollutants are labeled. The summary data are listed in Table S2 and Excel Table S2. Note: BCF, bioconcentration factor; BW, body weight; CI, confidence interval; Emax, efficacy; LD50, median lethal dose; NR, nuclear receptor; PPAR, peroxisome proliferator-activated receptor; ToxPi, Toxicological Priority Index.