. 2021 Apr 30;129(4):047013. doi: 10.1289/EHP8495

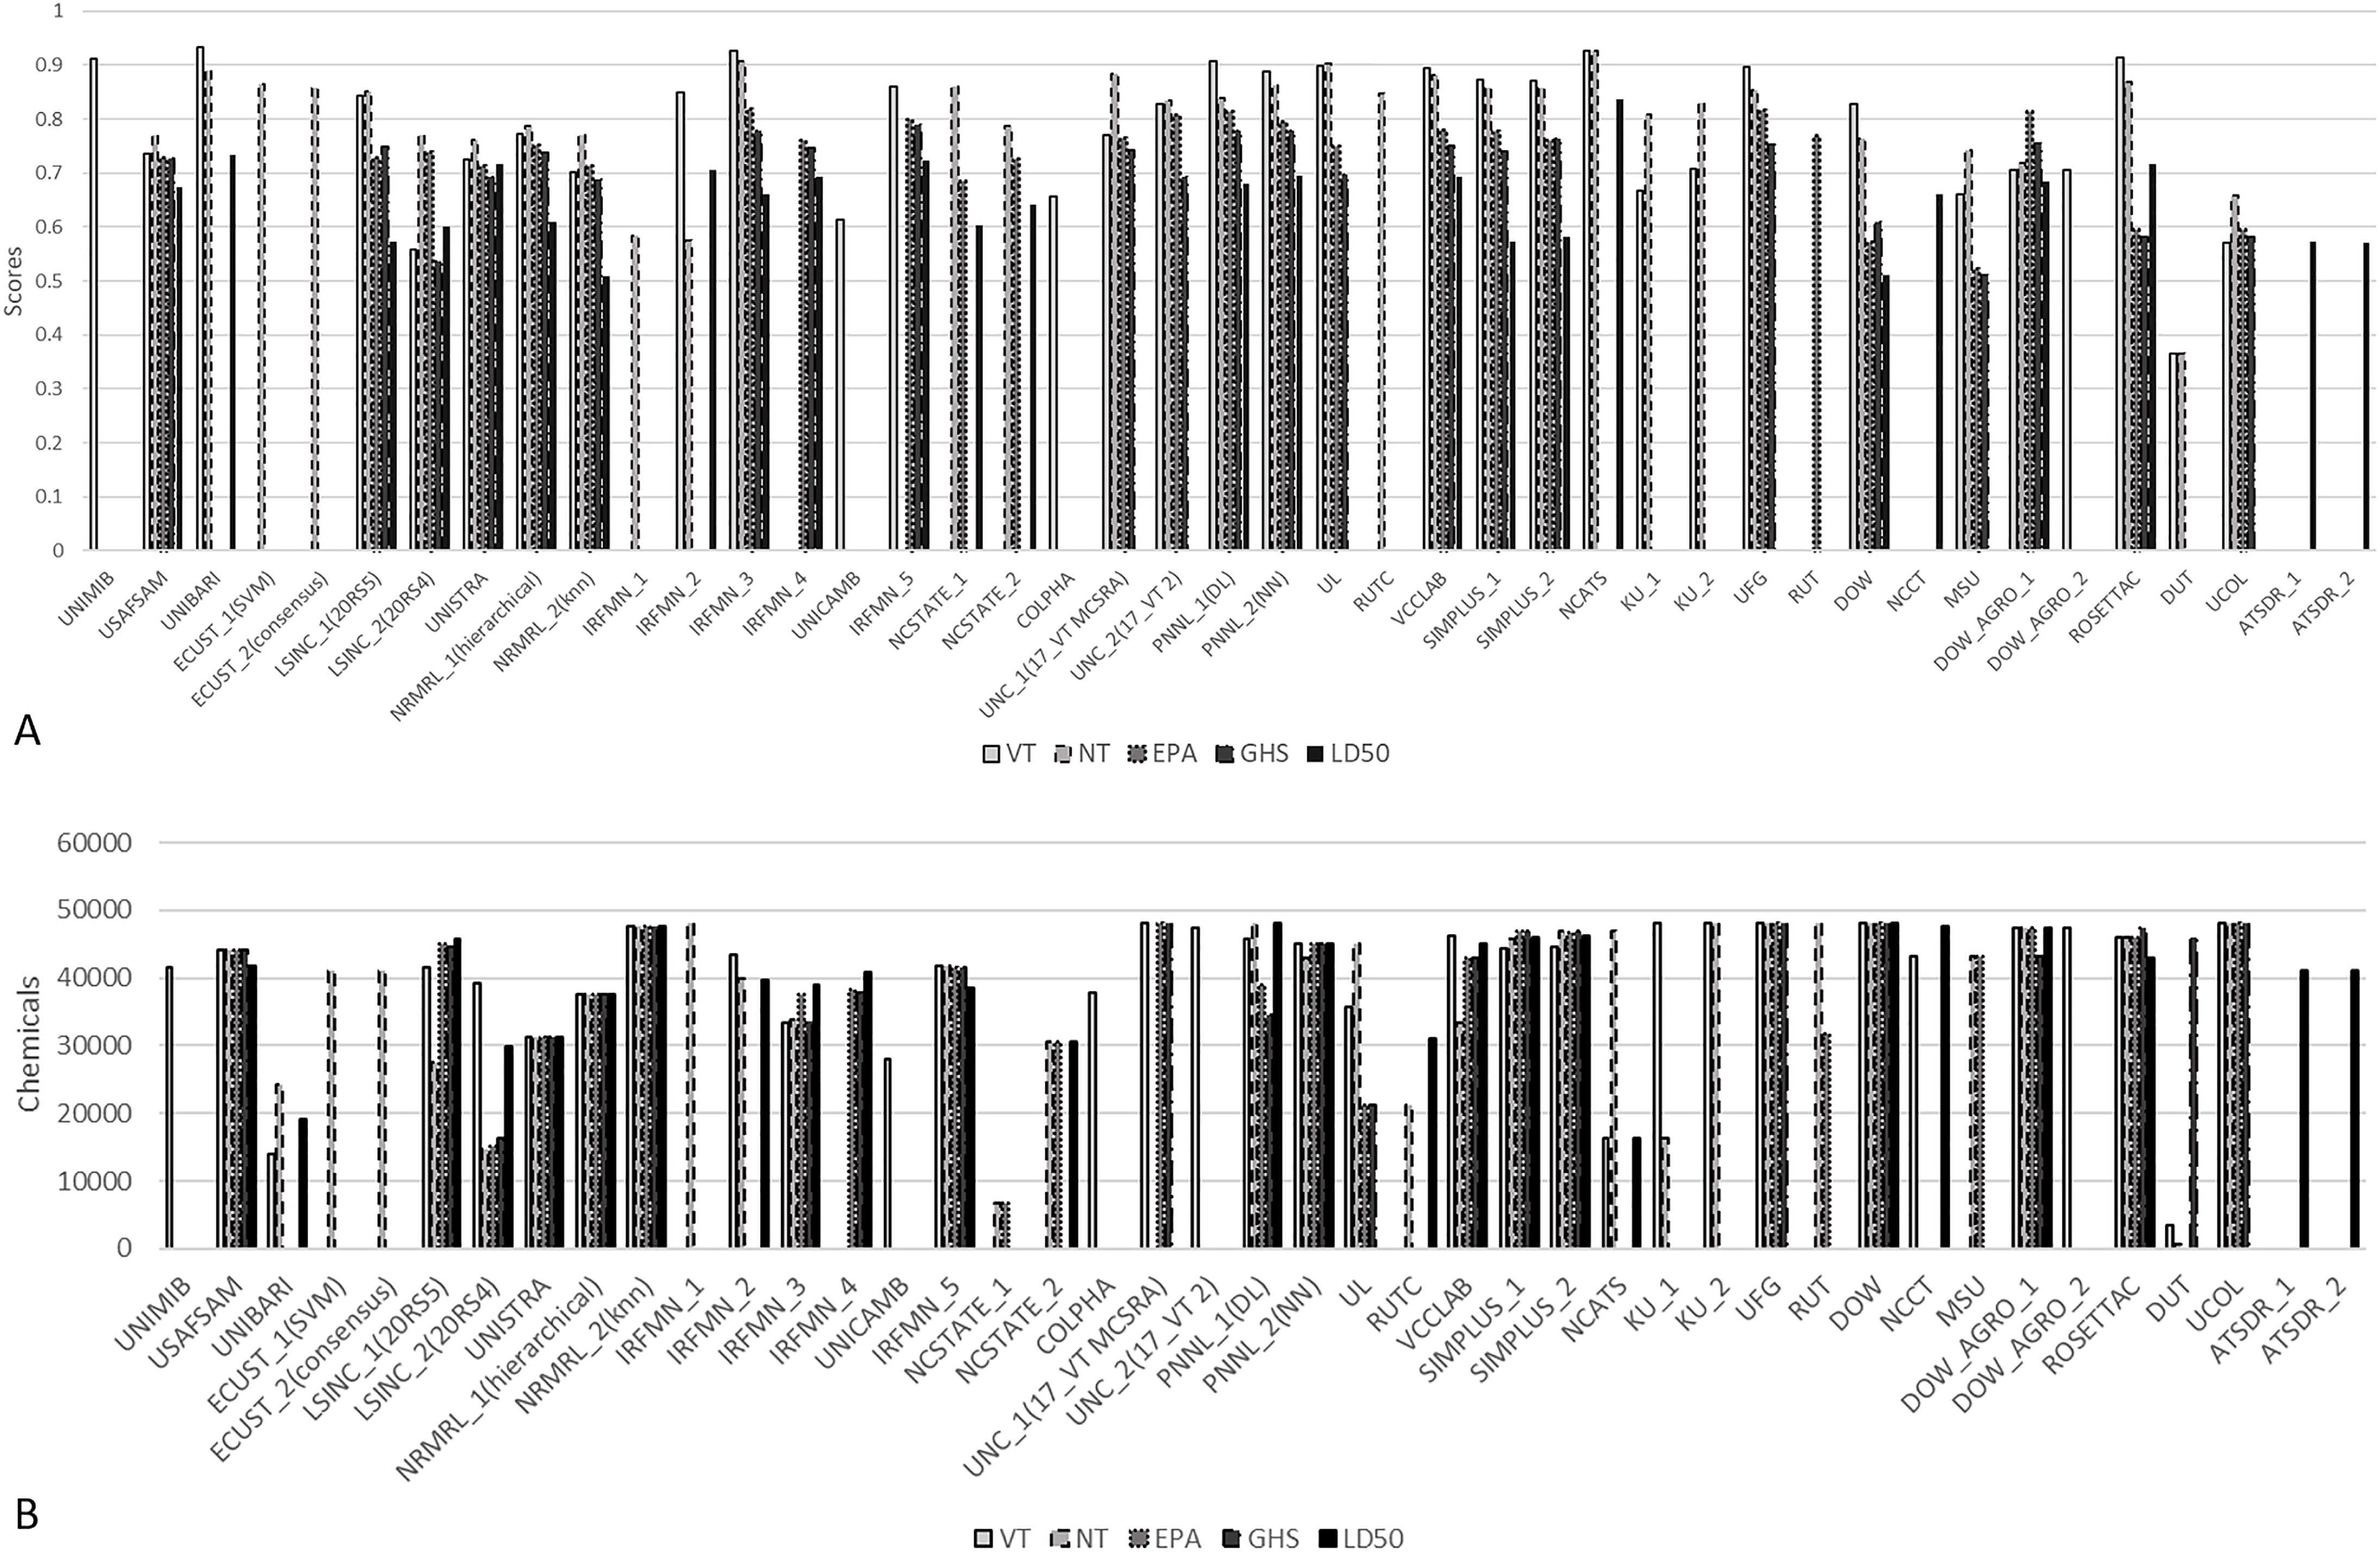
Figure 2.

Figure 2A is a clustered bar graph plotting scores, ranging from 0 to 1 in unit increments (y-axis) across U N I M I B, U S A F S A M, U N I B A R I, E C U S T underscore 1 (S V M), E C U S T underscore 2 (consensus), L S I N C underscore 1 (20 R 55), L S I N C underscore 2 (20 R 54), U N I S T R A, N R M R L underscore 1 (hierarchical), N R M R L underscore 2 (K Nearest Neighbor), I R F M N underscore 1, I R F M N underscore 2, I R F M N underscore 3, I R F M N underscore 4, N C S T A T E underscore 1, N C S T A T E underscore 2, C O L P H A, U N C underscore 1 (17 underscore V T M C S R A), U N C underscore 2 (17 underscore V T 2), P N N L underscore 1(D L), U L, R U T C, V C C L A B, S I M P L U S underscore 1, S I M P L U S underscore 2, N C A T S, K U underscore 1, K U underscore 2, U F G, R U T, D O W, N C C T, M S U, D O W underscore A G R O underscore 2, R O S E T T A C, D U T, U C O L, A T S D R underscore 1, and A T S D R underscore 2 (x-axis) for very toxic, non-toxic, Environmental Protection Agency, United Nations Globally Harmonized System of Classification and Labeling of Chemicals, and dose of a substance that would be expected to kill half the animals in a test group. Figures 2B is a clustered bar graph plotting scores, ranging from 0 to 60000 in increments of 10000 (y-axis) across U N I M I B, U S A F S A M, U N I B A R I, E C U S T underscore 1 (S V M), E C U S T underscore 2 (consensus), L S I N C underscore 1 (20 R 55), L S I N C underscore 2 (20 R 54), U N I S T R A, N R M R L underscore 1 (hierarchical), N R M R L underscore 2 (K Nearest Neighbor), I R F M N underscore 1, I R F M N underscore 2, I R F M N underscore 3, I R F M N underscore 4, N C S T A T E underscore 1, N C S T A T E underscore 2, C O L P H A, U N C underscore 1 (17 underscore V T M C S R A), U N C underscore 2 (17 underscore V T 2), P N N L underscore 1(D L), U L, R U T C, V C C L A B, S I M P L U S underscore 1, S I M P L U S underscore 2, N C A T S, K U underscore 1, K U underscore 2, U F G, R U T, D O W, N C C T, M S U, D O W underscore A G R O underscore 2, R O S E T T A C, D U T, U C O L, A T S D R underscore 1, and A T S D R underscore 2 (x-axis) for very toxic, non-toxic, Environmental Protection Agency, United Nations Globally Harmonized System of Classification and Labeling of Chemicals, and dose of a substance that would be expected to kill half the animals in a test group.

Evaluation scores (A) and coverage of the prediction set (B) by the submitted models. See Supplemental Material 5 and 6 for Figure 2A and B, respectively. Modeling groups along the x-axis are defined in Table 4.