. 2021 Apr 30;129(4):047013. doi: 10.1289/EHP8495

Figure 3.

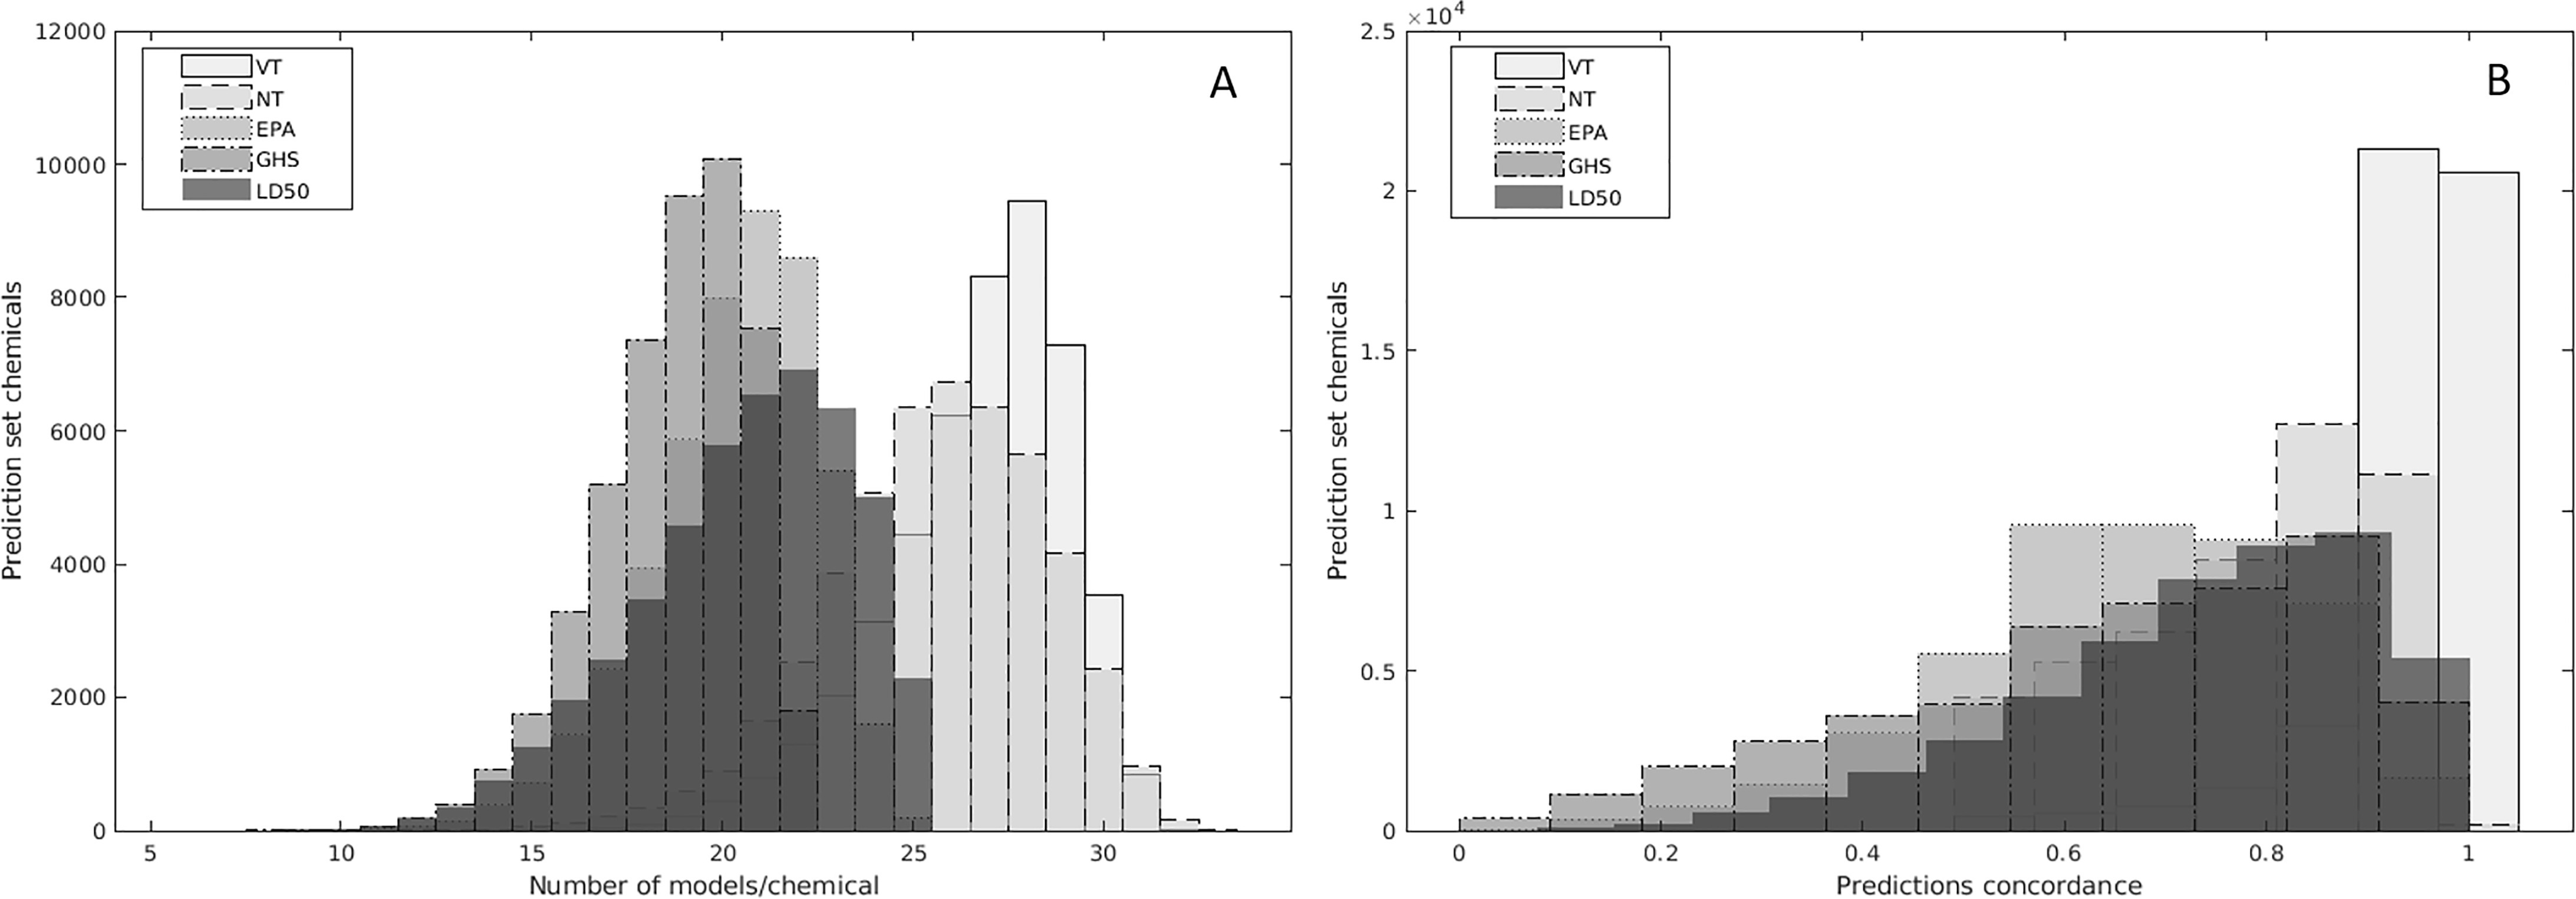
Figures 3A and 3B are stacked histograms plotting prediction set chemicals, ranging from 0 to 12000 in increments of 2000 and 0 to 2.5 times 10 begin superscript 4 end superscript in increments of 0.5 (y-axis) across number of models or chemicals, ranging from 5 to 30 in increments 5 and predictions concordance, ranging from 0 to 1 in increments of 0.2 (x-axis) for very toxic, non-toxic, Environmental Protection Agency, United Nations Globally Harmonized System of Classification and Labeling of Chemicals, and dose of a substance that would be expected to kill half the animals in a test group, respectively.

Distributions of the coverage of the prediction set chemicals (A) and concordance among the single models (B) across the five end points. See Supplemental Material 7.