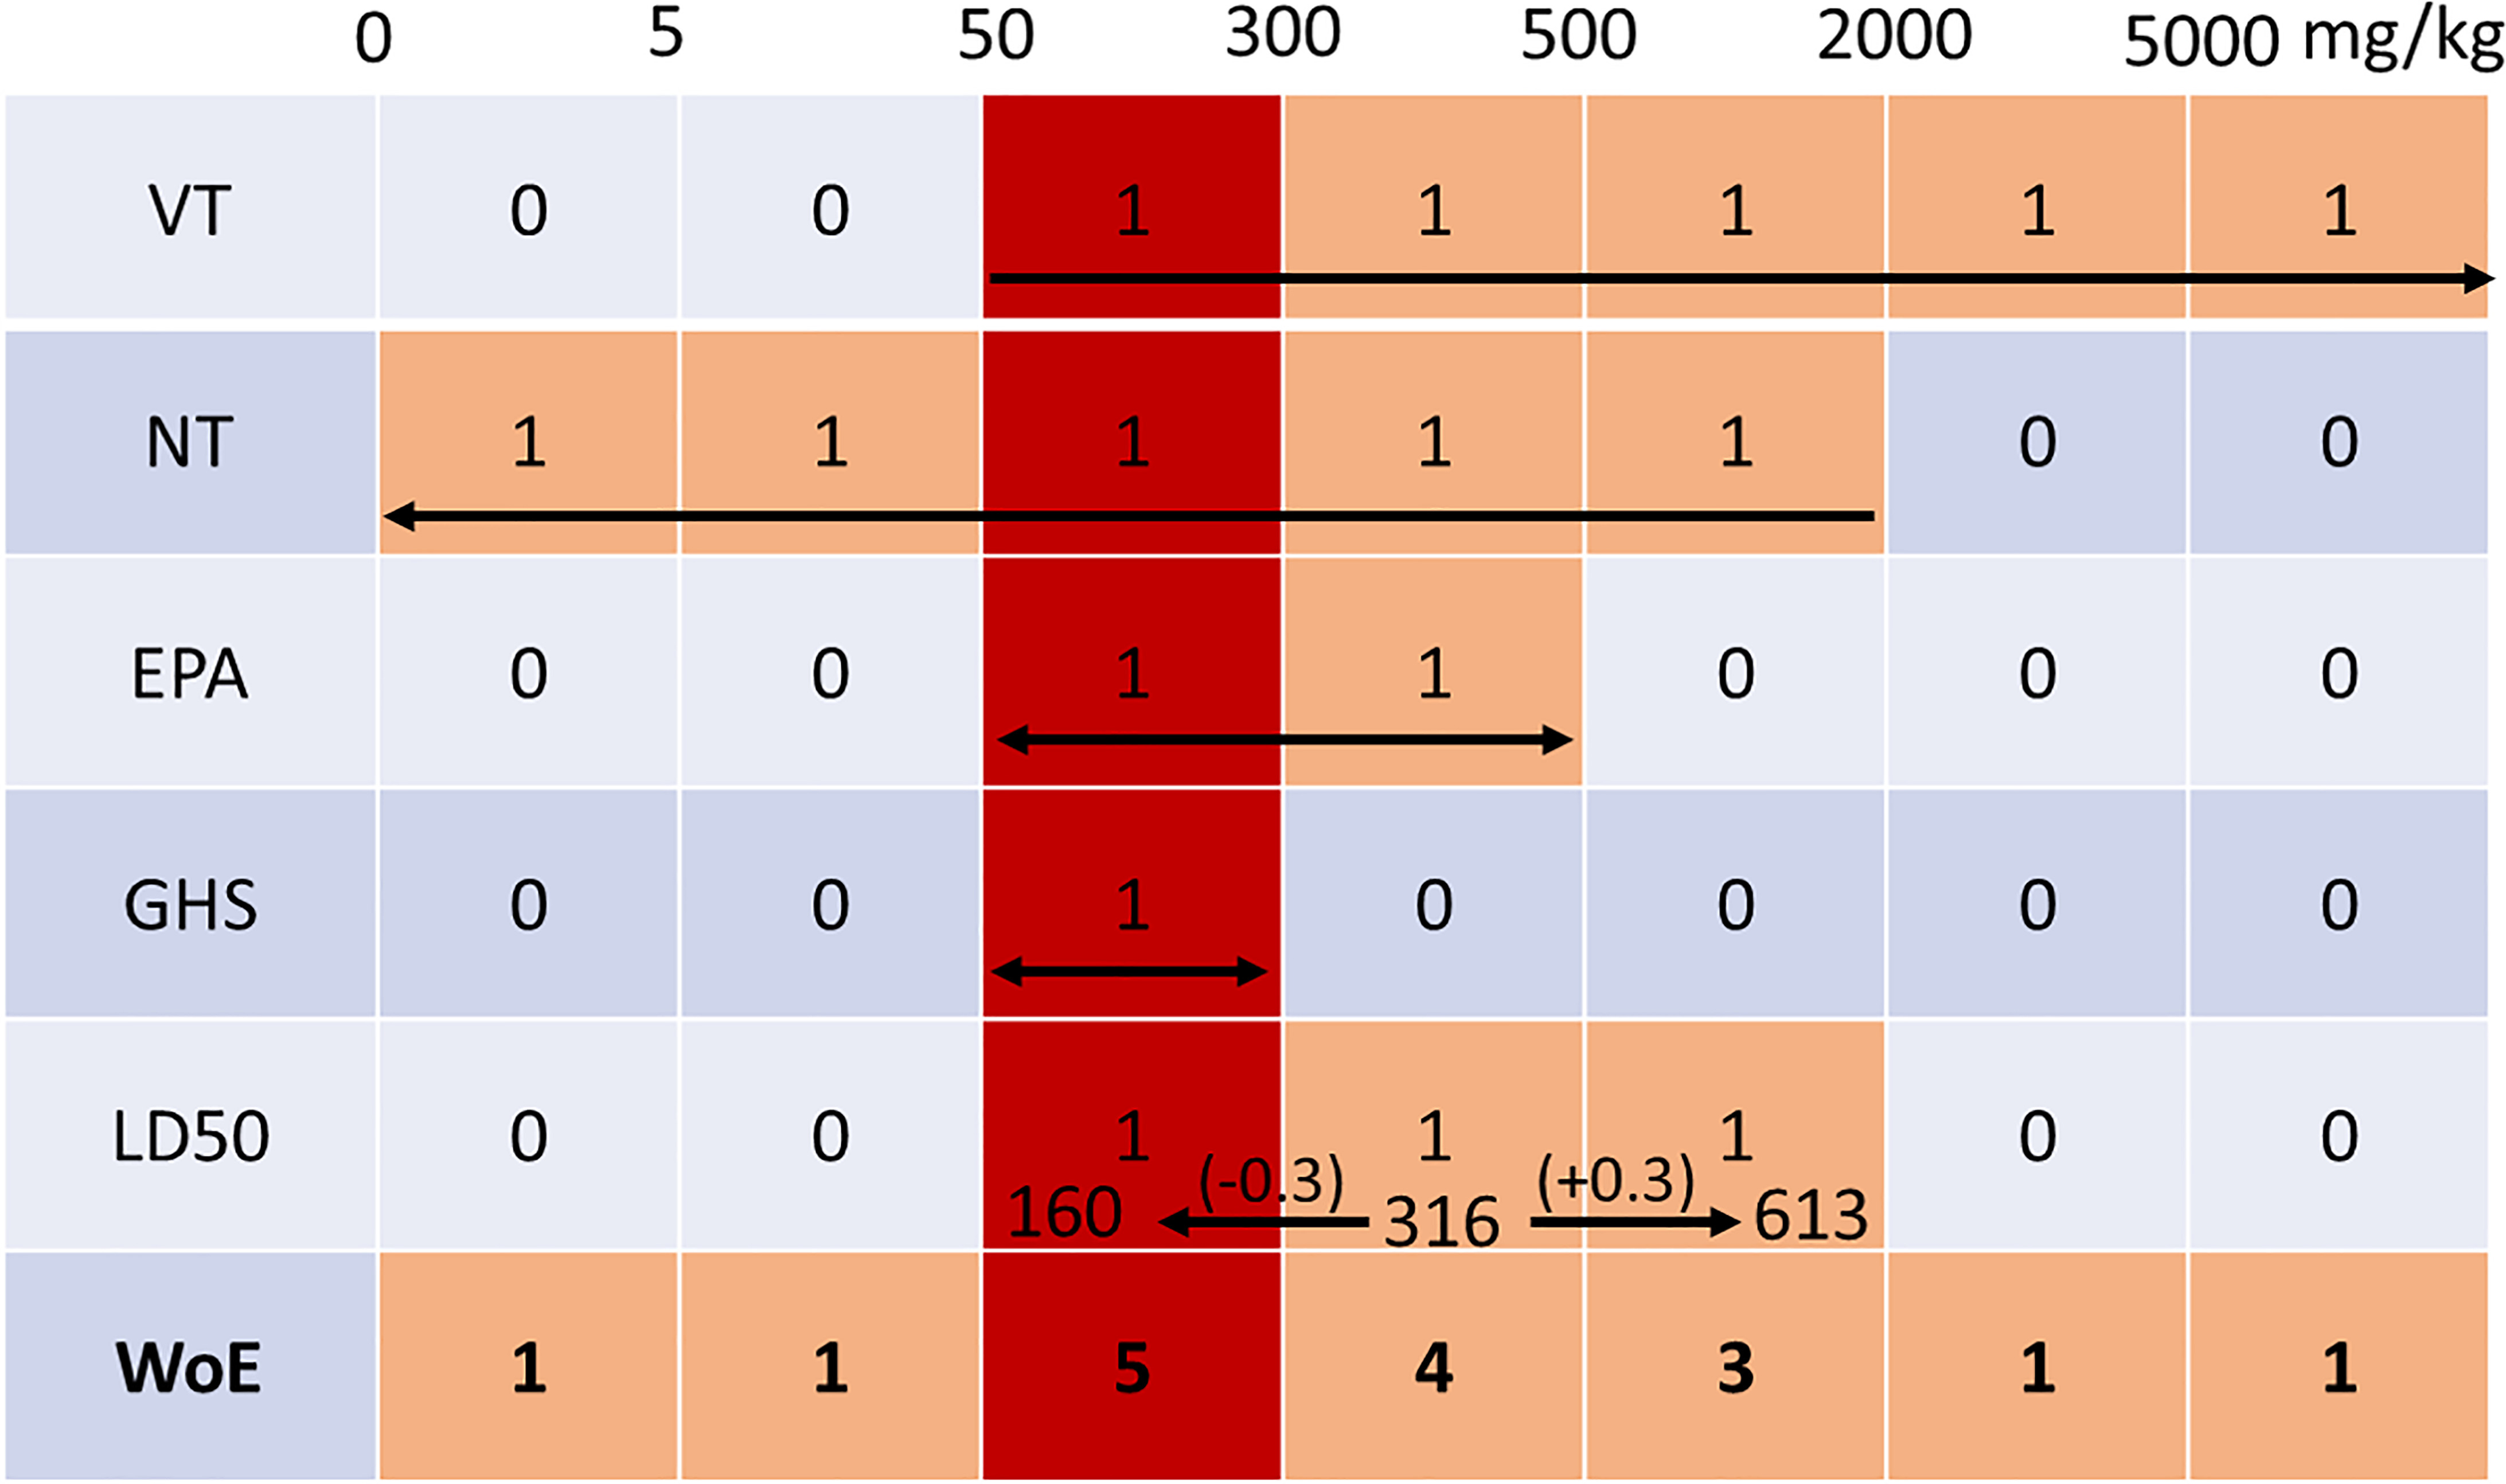
Figure 4.

Example of identifying the winning bin and reconciling the consensus predictions across five end points using the WoE (weight of evidence) approach. The columns represent the different bins from the EPA and GHS categories combined. The rows represent the five different end points and the WoE prediction. The arrows in each row represent the range of the prediction for each end point which were attributed a value of 1 and outside of it a value of 0. For the end point, the range limits are calculated by adding and subtracting the confidence interval of 0.3 in log value to the original prediction of resulting in a range of 160 to . The winning bin is determined by the maximum of the sum of each column in the WoE row. Note: EPA, U.S. Environmental Protection Agency; GHS, U.N. Globally Harmonized System of Classification and Labeling of Chemicals; , dose of a substance that would be expected to kill half the animals in a test group; NT, nontoxic/toxic; VT, very toxic/not very toxic; WoE, weight of evidence.
