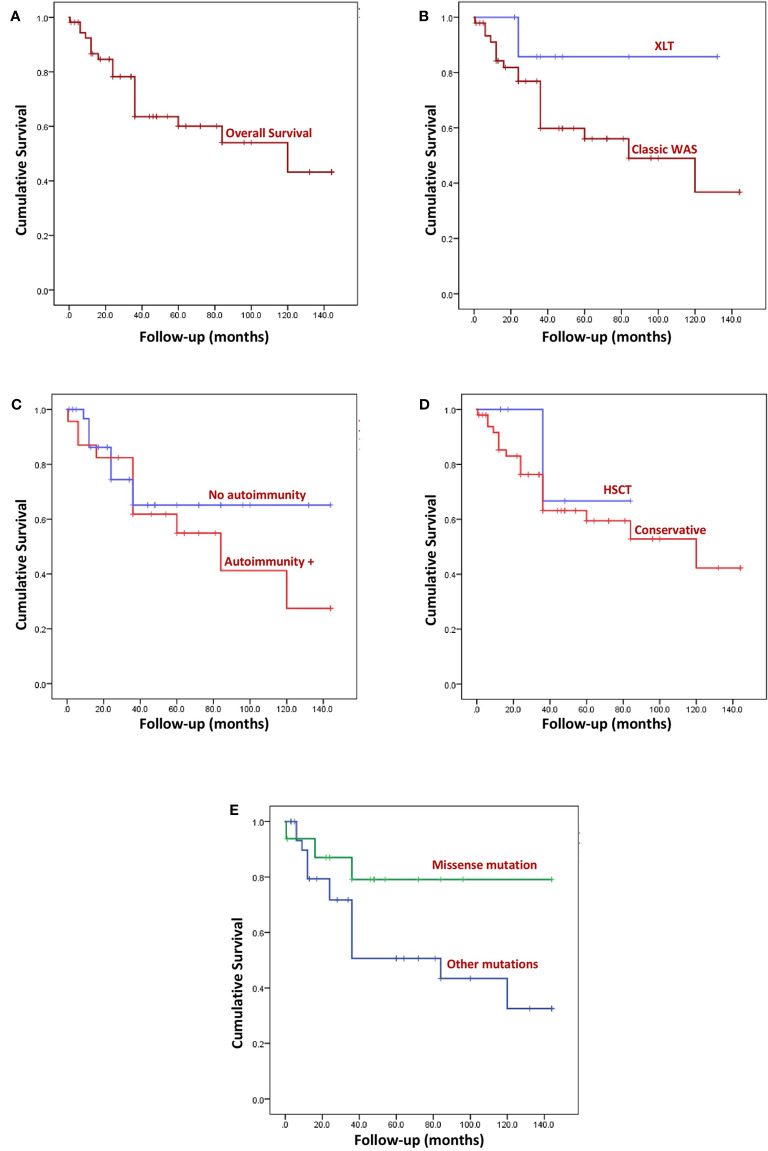
Figure 4.
Kaplan Meier survival curves. (A) Overall survival (OS) of the entire cohort. Median follow-up was 36 months (range: 2 weeks- 12 years). (B) Comparison of OS between XLT and WAS, (p 0.154). (C) Comparison of OS of patients with autoimmune manifestation and without autoimmunity, (p 0.410). (D) Comparison of OS of patients who underwent HSCT and patients who were not transplanted, (p 0.543). (E) Comparison of OS of patients who had missense variants and those with variants other than missense mutation, (p 0.083).

