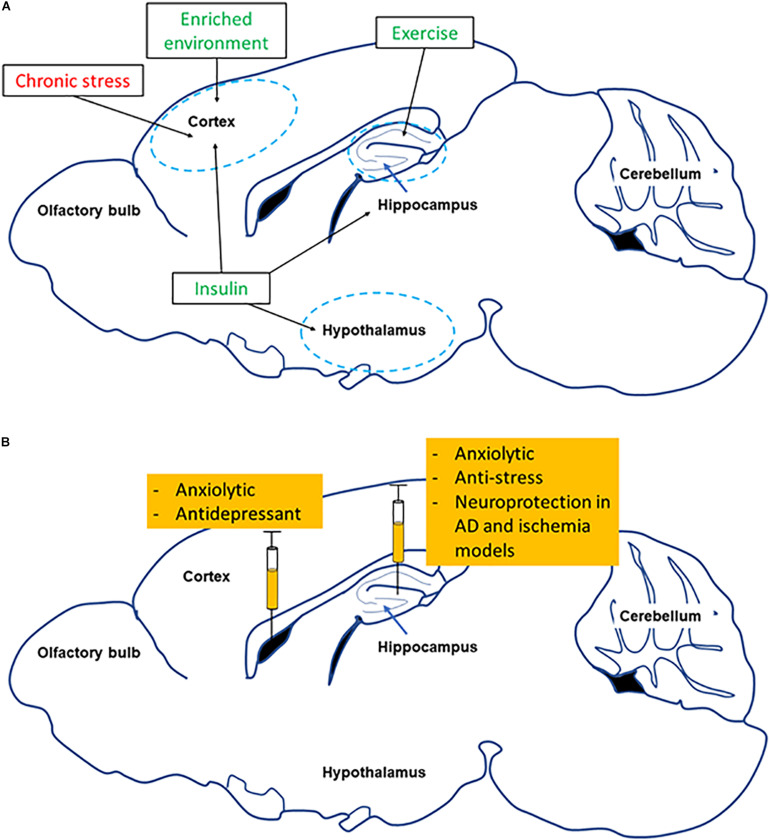
FIGURE 3.
Summary of effects of changing FNDC5/Irisin levels in different brain regions. (A) Shows how several environmental factors lead to alterations in FNDC5/Irisin levels in different brain regions (red symbolizes reduction, green means increase). (B) Shows the effect of directly manipulating levels of FNDC5/Irisin on neurobehavior and neuroprotection.

