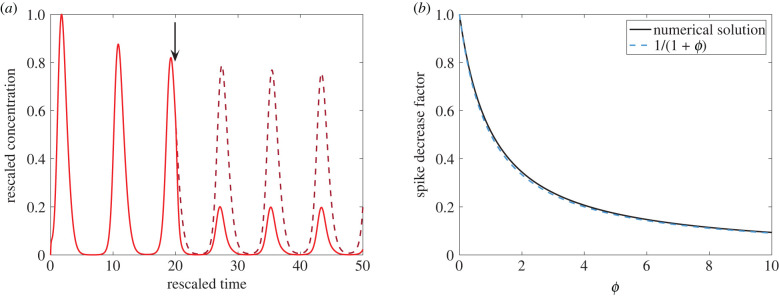
Figure 5.
Intervening inflammation using inhaled corticosteroids. The severe inflammation parameter regime in table 2 is used prior to intervention (0 < t < 20). (a) At t = 20 (black arrow), ϕ is increased from 0 to 3 (red solid curve), reducing pro-inflammatory cytokine levels. The C(t) trajectory without intervention (ϕ = 0) is shown as a dark red dashed curve. (b) The height of the pro-inflammatory cytokine spike, relative to no intervention, decreases as ϕ increases. The numerically computed spike height decrease is shown in solid black, while the approximate decrease factor F(ϕ) = 1/(1 + ϕ) is shown in dashed blue.

