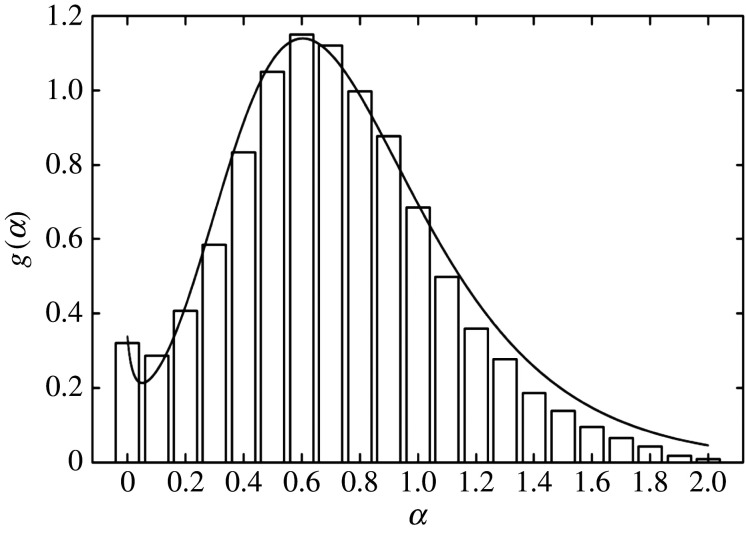
Figure 2.
The normalized marginal distribution g(α). The histogram describes the probability to find a given value of the anomalous diffusion coefficient α and is based on the experimental data of fig. 2(c) in [8]. The solid line shows the distribution of equation (2.5) with equations (2.12) and (2.13): and .

