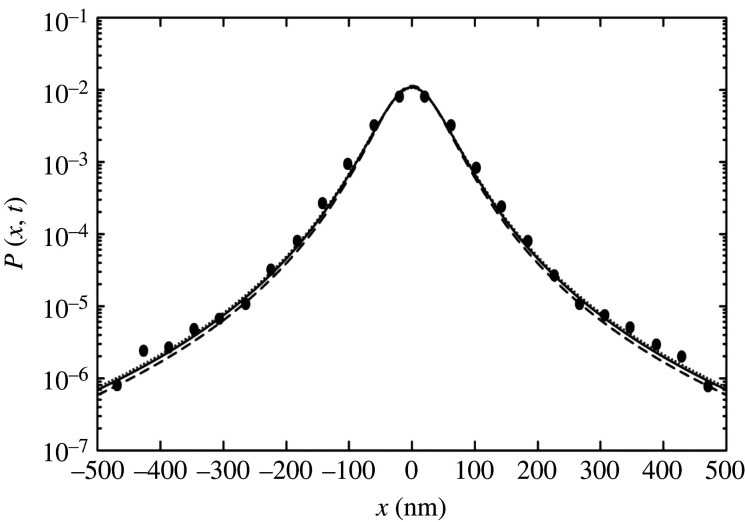
Figure 4.
Semi-log plot of the normalized distribution P(x, t) with variables x (nm) and t (s). This histogram uses the experimental data of fig. 4(a) in [8]. The three lines show the q-Gaussian distributions of equation (2.9): for the dashed line, for the solid line and for the dotted line [8]. and are considered.

