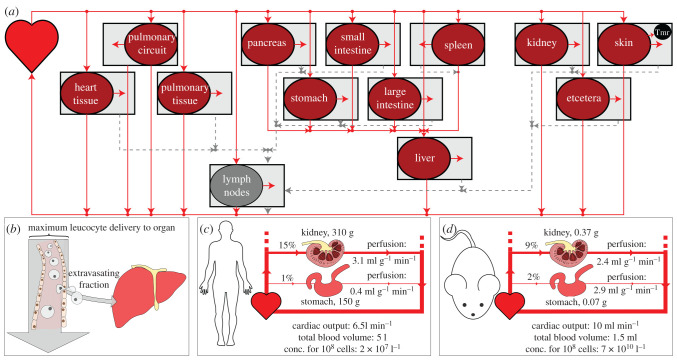
Figure 1.
(a) A visual summary of a model of the circulatory system. Solid and dotted lines represent blood and lymph flow, respectively. Cells flow from the heart to each organ, from which a proportion enters the interstitial space. Cells from the interstitium flow via the lymphatics back to the heart. A tumour (tmr) can be represented by choosing a tumour bearing organ (the skin in this example) from which proportions of its volume and blood supply are occupied by the tumour. (b) Only a fraction of cells delivered by the vasculature extravasate into a given organ, but the entry rate can be no higher than the vascular delivery rate. Calculation of these maximum delivery rates yields insight into inter-species and inter-organ delivery of cellular therapies. (c,d) The perfusion of different organs can differ substantially between humans (c) and mice (d). Multiplying cellular concentrations by perfusion gives maximum delivery per volume (or mass) of tissue. Anatomical values given are examples; these parameters differ by experimental reference used.

