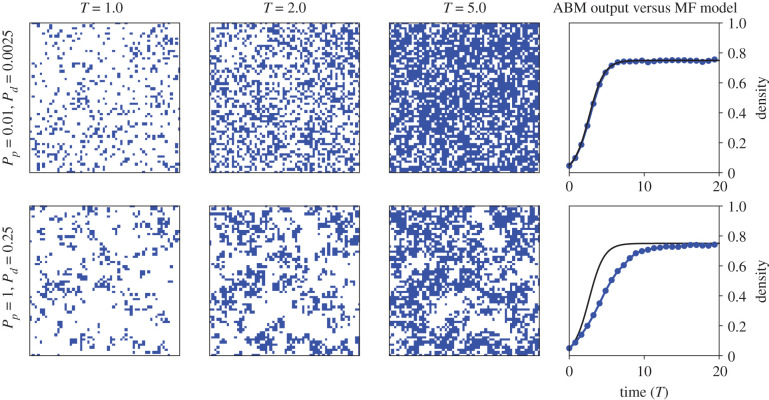
Figure 2.
ABM simulation snap shots for the BDM ABM. Blue pixels denote Aα(t) and white pixels denote 0α(t). Simulations were computed with agent migration rate Pm = 1. The right-most column depicts the output agent density from one ABM simulation (blue line and dots) against the solution of the logistic equation (2.7) (solid black line). Quantities are plotted against non-dimensionalized time T = (Pp − Pd)t for ease of interpretation. The ABM was computed on a square lattice of length X = 120.

