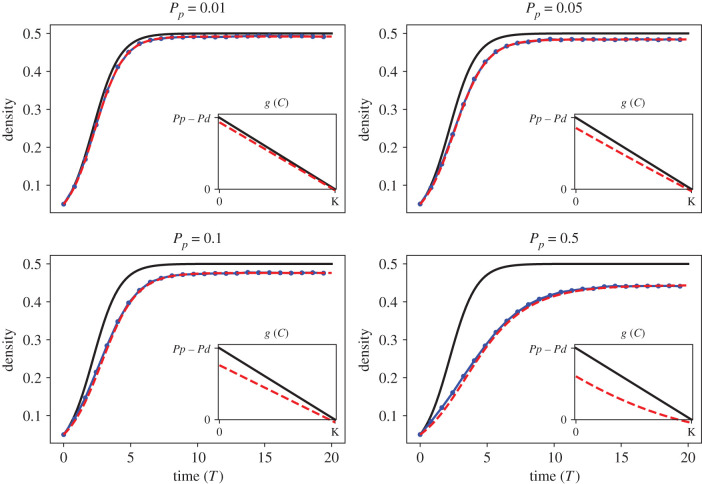
Figure 6.
Case study 1. Comparing mean-field and learned model predictions to ABM data from the BDM process. In each figure, we depict 〈CABM(t)〉 (blue dots and line) against the corresponding mean-field model (solid black line) and learned equation (red dashed line). All simulations are depicted as a function of non-dimensionalized time T = t(Pp − Pd). The insets in all frames depict the predicted percapita growth rates, , from both models where .

