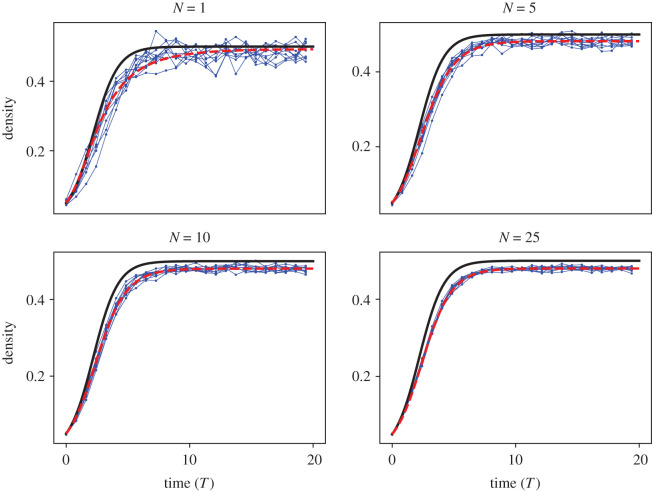
Figure 7.
Case study 2. Learning equations from varying numbers of ABM simulations. In each figure, we depict ten realizations of 〈CABM(t)〉 (blue dots and line) against the corresponding mean-field model (solid black line) and averaged learned equation, (red dashed line), which depicts the final learned equation whose coefficients were averaged over all the learned DE models for each realization of 〈CABM(t)〉. Each realization of 〈CABM(t)〉 was averaged over N = 1 (top left), N = 5 (top right), N = 10 (bottom left), and N = 25 (bottom right) simulations of the BDM model. Each individual simulation was initialized by placing agents uniformly at random throughout the lattice so that 5% of lattice sites were occupied. All simulations are depicted against non-dimensionalized time T = t(Pp − Pd). The ABM parameters used in these simulations are Pp = 0.01, Pd = 0.005, Pm = 1.

