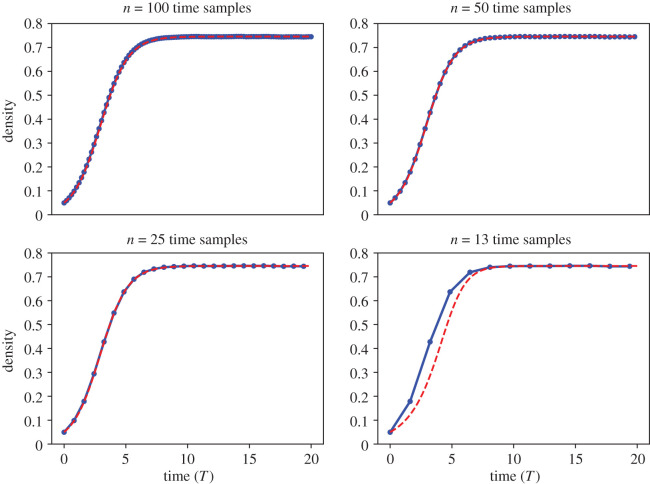
Figure 8.
Case study 3a. Learning equations with varying time resolution. We applied the EQL methodology for ABM data with n = 13, 25, 50 or 100 time samples and depict the learned model (red dashed line) against the ABM data (blue solid line and dots). All simulations are depicted against non-dimensionalized time T = t(Pp − Pd). We fixed Pp = 0.05, .

