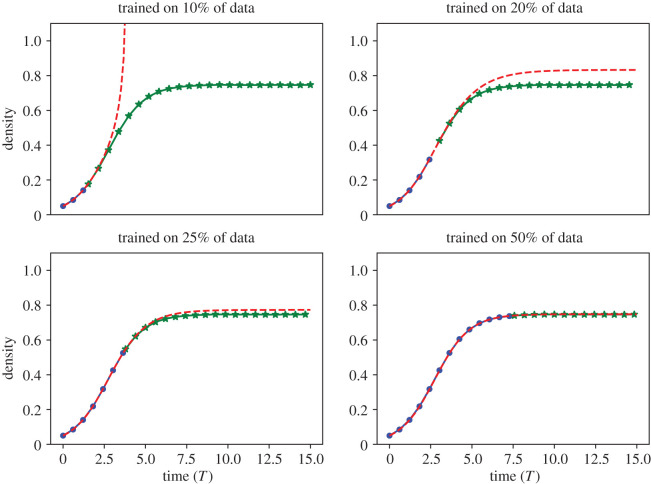
Figure 9.
Case study 3b. Predicting BDM dynamics from partial ABM data. We applied the EQL methodology on the first 10% (top left), 20% (top right), 25% (bottom left) and 50% (bottom right) of 〈CABM(t)〉 to investigate the learned equations performance in predicting unobserved ABM dynamics. The blue dots correspond to ABM output that was used to infer the learned model, the green stars denote ABM output that was used for model testing, and the red dashed line denotes the solution of the learned model. All simulations are depicted against non-dimensionalized time T = t(Pp − Pd). We fixed Pp = 0.01, Pd = 0.005 and Pm = 1 in each scenario and averaged ABM output over N = 50 simulations.

