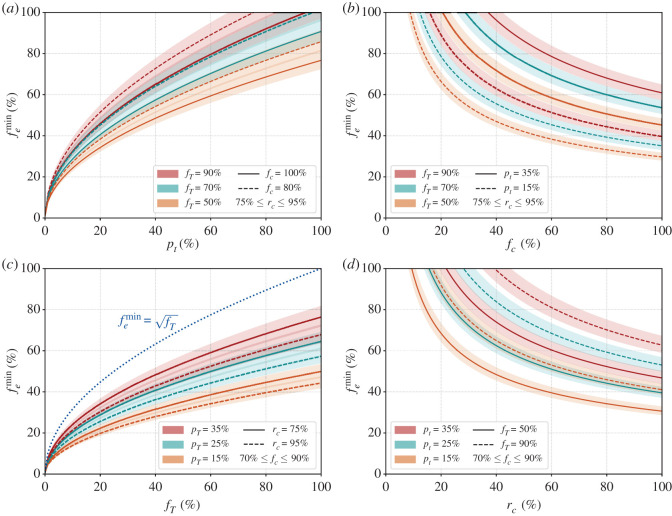
Figure 2.
Percentage of the population that needs to be enrolled () for automated contact tracing to be successful. Starting from the left, the solid and dashed lines represent , respectively, for the first panel, for the second panel, for the third panel and for the fourth panel. For the left two panels, the fraction of truly infected individuals that will be confirmed as infected by testing, rc is varied between 75% and 95%. For the right two panels, the fraction of people who will confirm they have been tested as infected if they are enrolled, fc is varied between 70% and 90%. Three cases for the minimum fraction of the individuals at risk that need to be traced are considered with in orange, green and red, respectively, in the left two panels and similarly, three cases are considered for in the right two panels. The blue dotted line in the third panel from the left gives the threshold variation of with fT when all other parameters are set to 1. The y-axes are identical for all panels. See text for more details.

