
Figure 3.
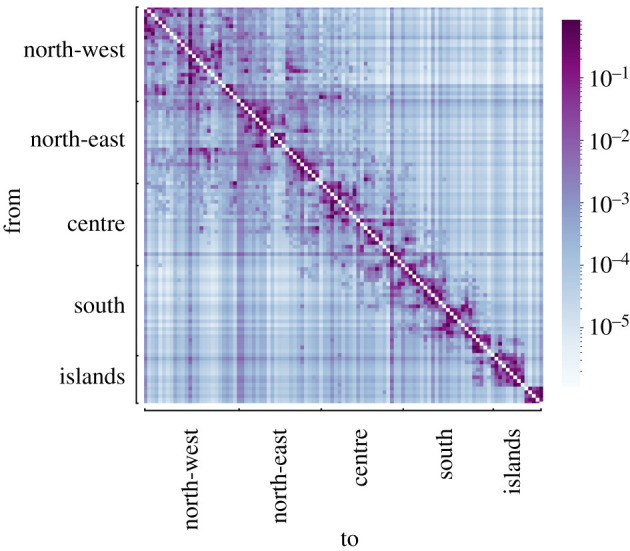
Heat map representing the routing matrix W between provinces estimated from [39]. The colour code represents the fraction of active people who travel from one province to another. Provinces are gathered in macro-regions, as detailed and illustrated in the electronic supplementary material, §S1 and figure S1.