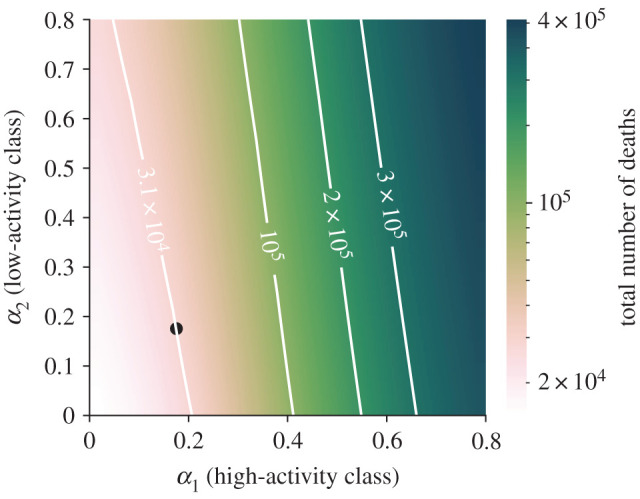
Figure 7.

Effect of targeted lockdown strategies. We consider the total number of deaths over a time window of 104 days from the beginning of the simulation (4 February) to the time corresponding to the relaxation of the most severe NPIs in Italy (18 May). On the two axes, α1 and α2 correspond to activity reduction in high- and low-activity classes, respectively, where higher levels of α denote less severe NPIs. Level curves are shown to clarify how targeted interventions should be combined to produce the same effect on the total number of deaths. The black dot represents the identified activity reduction in model calibration.
