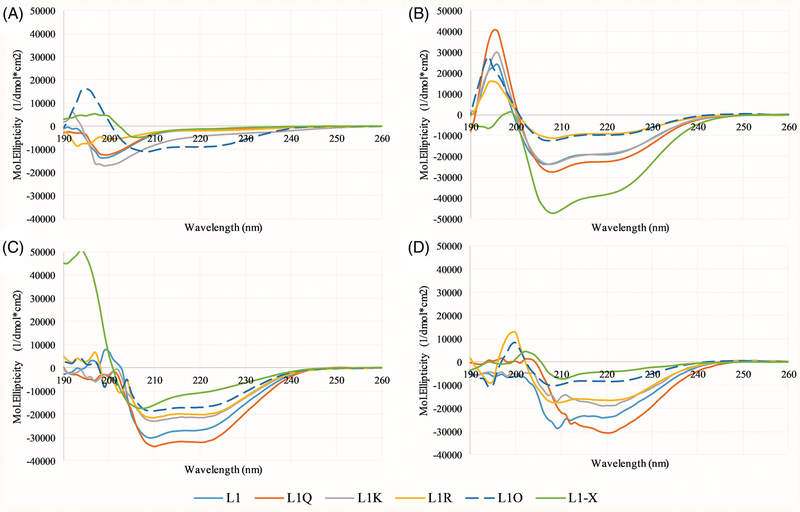
FIGURE 6.
Circular dichroism (CD) spectroscopy—Spectra of all peptides were collected in, A, 10X diluted PBS, B, 50:50 PBS:TFE using the 10X diluted PBS, C, in the presence of 250 μM 3:1 PC:PG vesicles, or, D, in the presence of 250 μM 3:1 PC:Cholesterol vesicles. In 10X diluted PBS and 50:50 PBS:TFE, the peptide concentration was 5 μM, while in the presence of lipid vesicles, the peptide concentration was 3 μM. L1 is shown in light blue, L1-Q in orange, L1-K in gray, L1-R in yellow, L1-O in dark blue, and L1-X in green. All data represent the average of 64 scans with correction of background spectra lacking peptide

