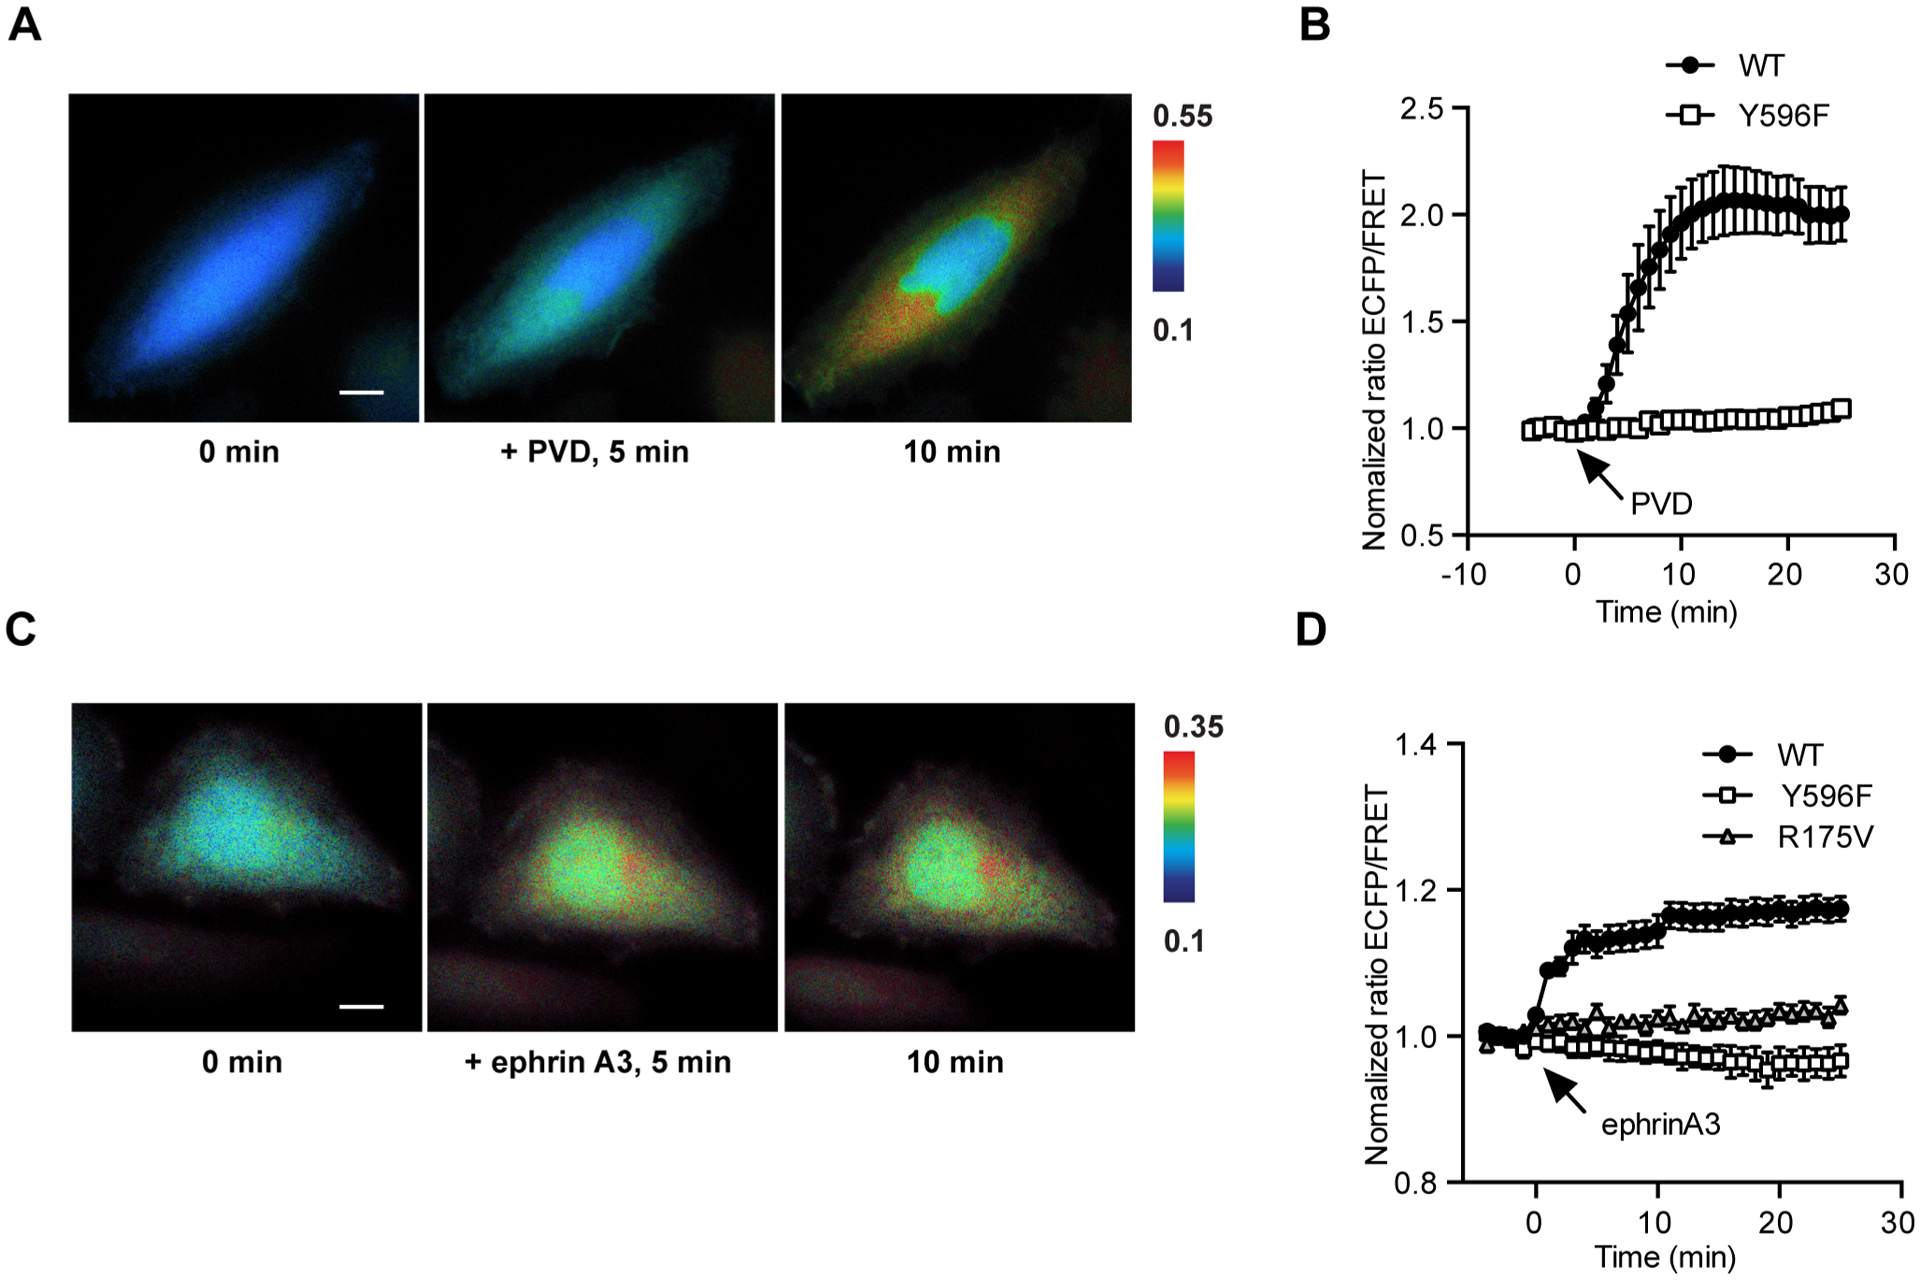
Figure 2.

FRET responses of the EphA4 biosensor in mammalian cells. (A) Representative images of ECFP/FRET ratios for the EphA4 biosensor in HeLa cells before and after PVD stimulation (100× objective lens, scale bar, 10 μm). Color scale bars in the figures are to show the ECFP/FRET ratios, with cold and hot colors representing low and high ratios, respectively. (B) Time courses of normalized ECFP/FRET ratios (mean ± SEM) for EphA4 wild-type EphA4 (n = 12, N = 3) or Y596F (n = 7, N = 3) mutant biosensor before and after PVD stimulation in HeLa cells. (C) Representative images of ECFP/FRET ratios for the EphA4 biosensor in HeLa cells before and after ephrinA3 stimulation (100× objective lens, scale bar, 10 μm). (D) Time courses of normalized ECFP/FRET ratios (mean ± SEM) for EphA4 wild -type (black squares, n = 21, N = 4), Y596F mutant (white squares, n = 6, N = 3) or R175 V mutant (triangle, n = 9, N = 3) biosensors before and after PVD stimulation in HeLa cells. Normalized ECFP/FRET ratio is normalized by the basal level of the averaged ratio of the biosensor in the same cell before stimulation. “n” means the total cell number. “N” means the number of individual experiment repeats.
