Figure 3.

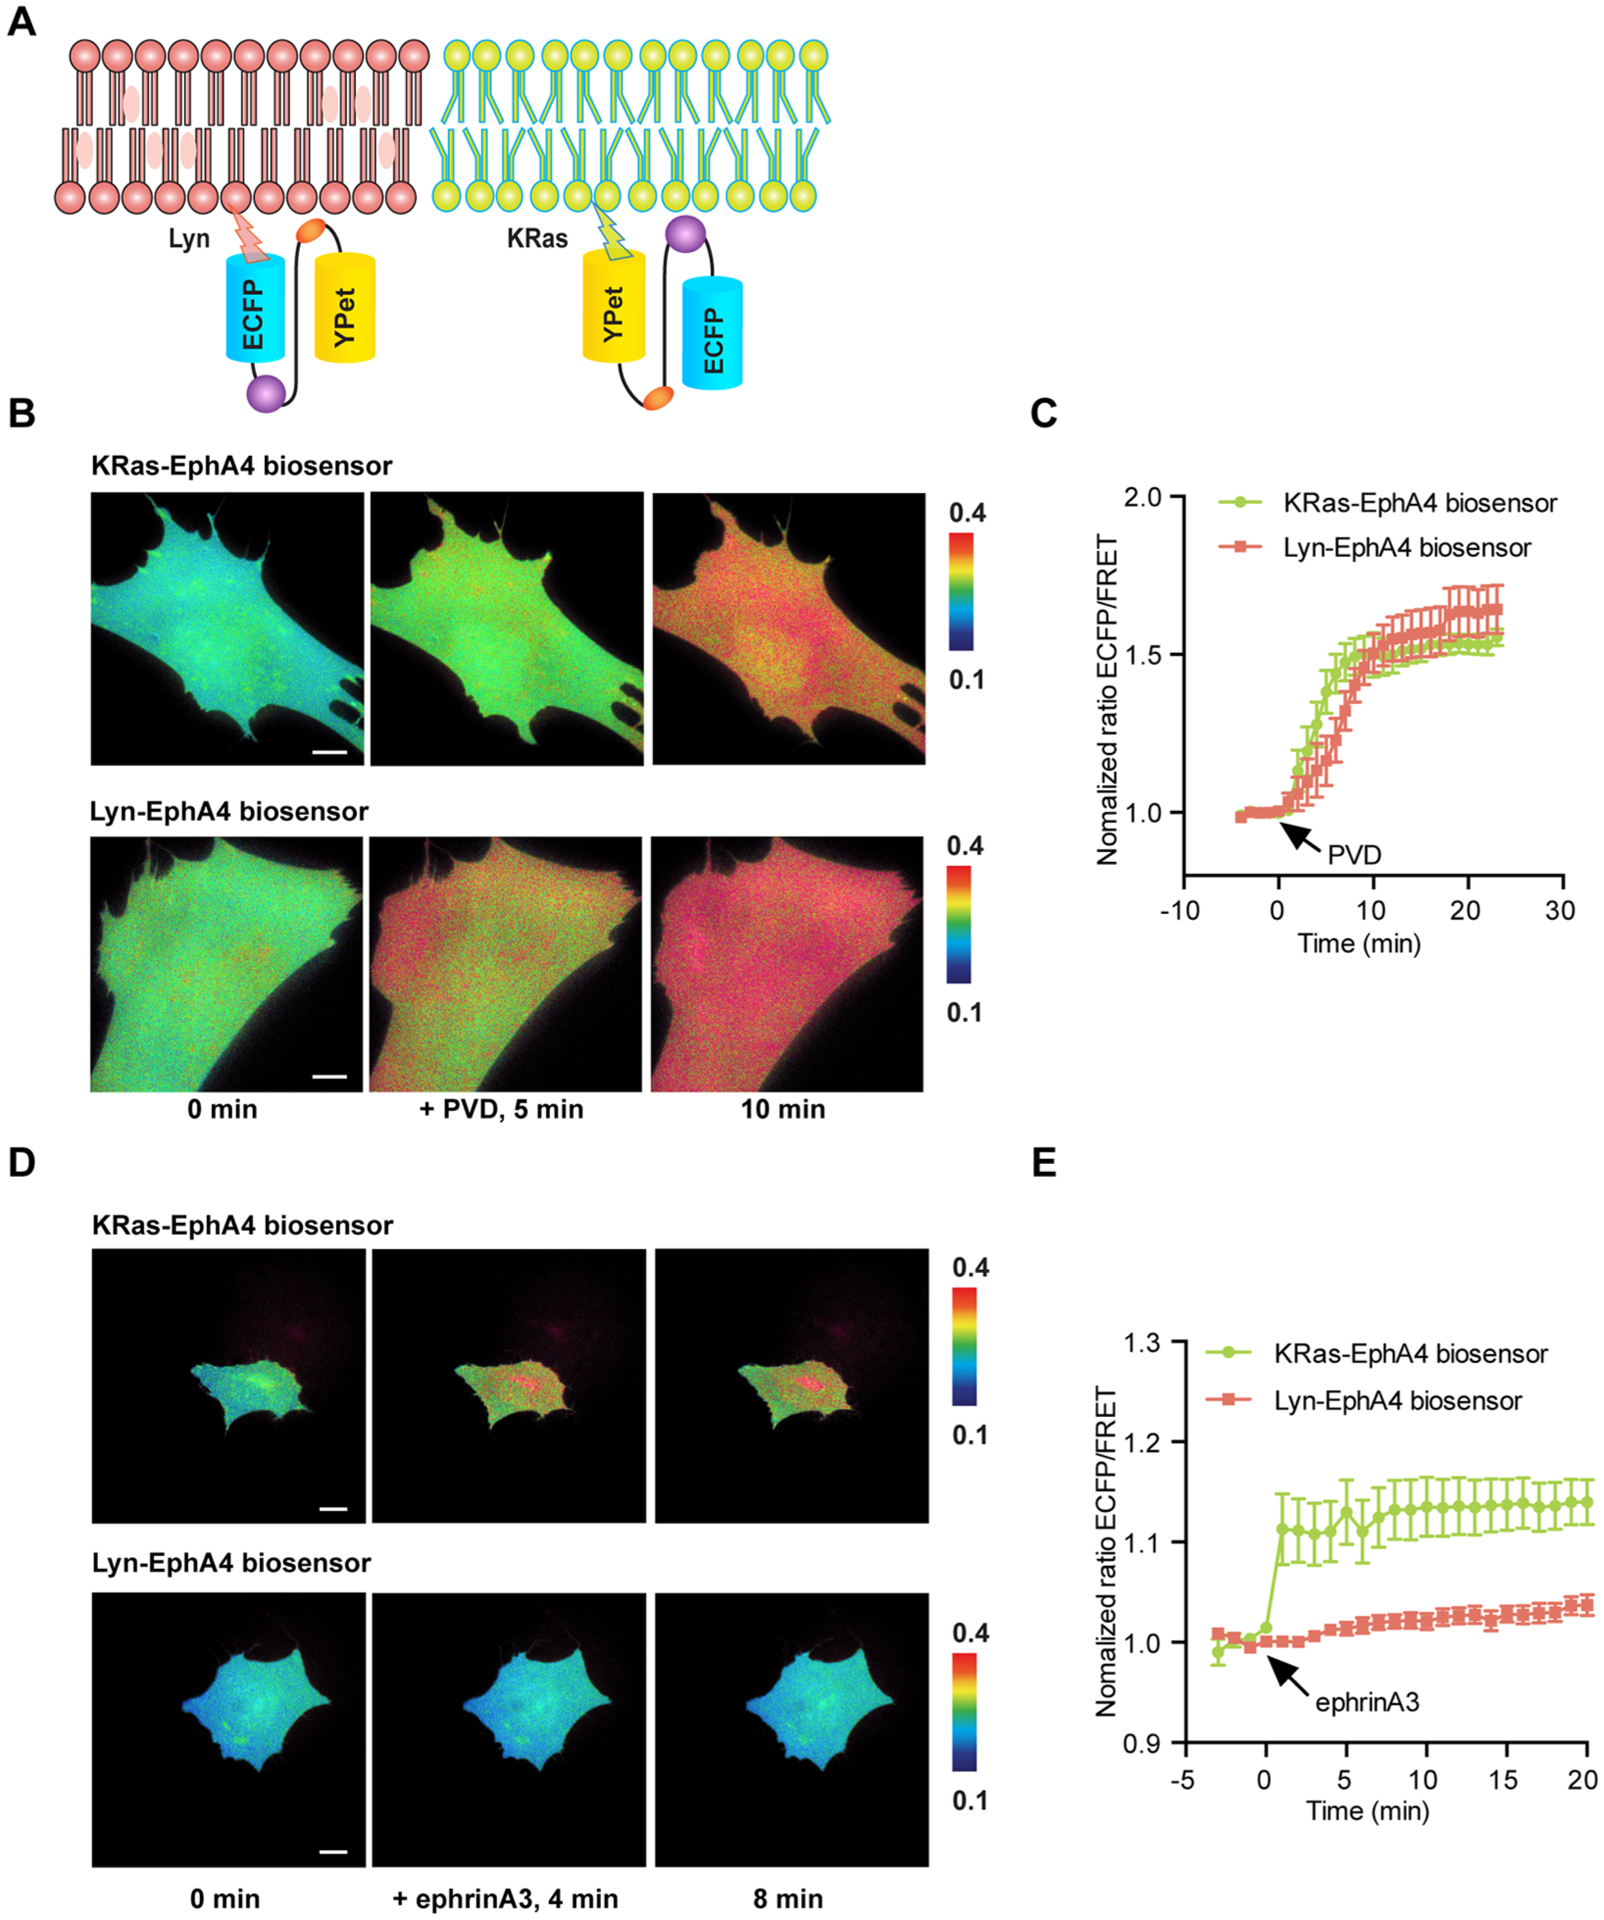
EphA4 activation in raft-like microdomains and non-raft regions. (A) The design principle of non-raft targeted (KRas-EphA4) and raft-targeted (Lyn-EphA4) biosensors. (B) Representative images KRas-EphA4 of ECFP/FRET ratios for the KRas-EphA4 and Lyn-EphA4 biosensors in MEF cells before and after PVD stimulation (100× objective lens, scale bar, 10 μm). (C) Time courses of normalized ECFP/FRET ratios (mean ± SEM) for the KRas-EphA4 biosensor (green line, n = 10, N = 3) and the Lyn-EphA4 biosensors (red line, n = 6, N = 3) before and after PVD stimulation in MEF cells. (D) Representative images of ECFP/FRET ratios for KRas-EphA4 and Lyn-EphA4 biosensors in MEF cells before and after ephrinA3 stimulation (40× objective lens, scale bar, 20 μm). (E) Time courses of normalized ECFP/FRET ratios (mean ± SEM) for the KRas-EphA4 biosensors (green line, n = 16, N = 3) and the Lyn-EphA4 biosensors (red line, n = 14, N = 3) before and after ephrinA3 stimulation in MEF cells. “n” means the total cell number. “N” means the number of individual experiment repeats.
