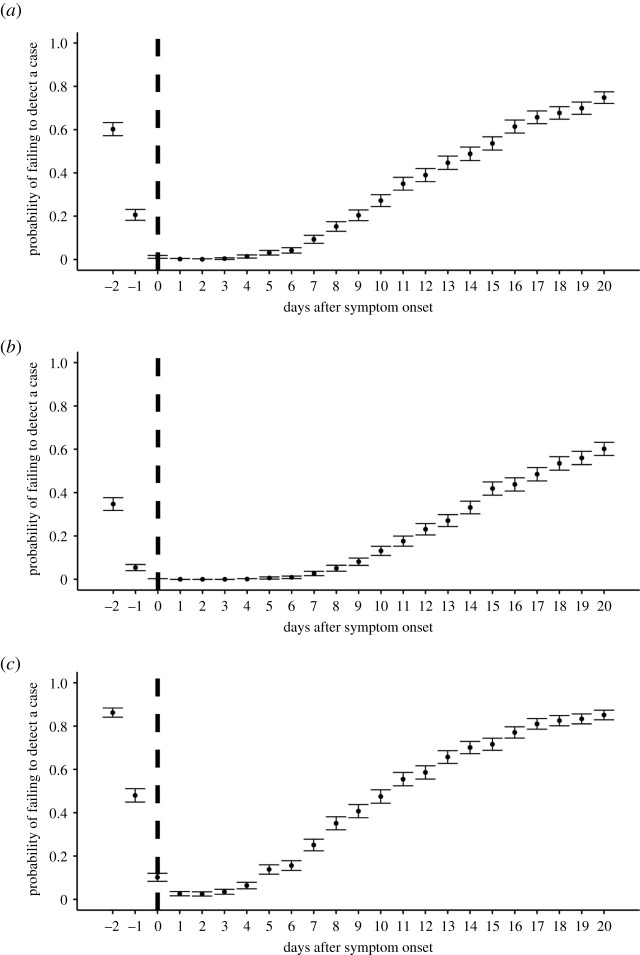
Figure 2.
The probability of failing to detect a case over time with different DLs. (a) DL = 100 copies ml−1, (b) DL = 10 copies ml−1, (c) DL = 1000 copies ml−1. The dots are the estimated probability of failing to detect a case at each time point and the bars correspond to the 95%CIs. The vertical dashed lines show the day of symptom onset.

