Figure 1.
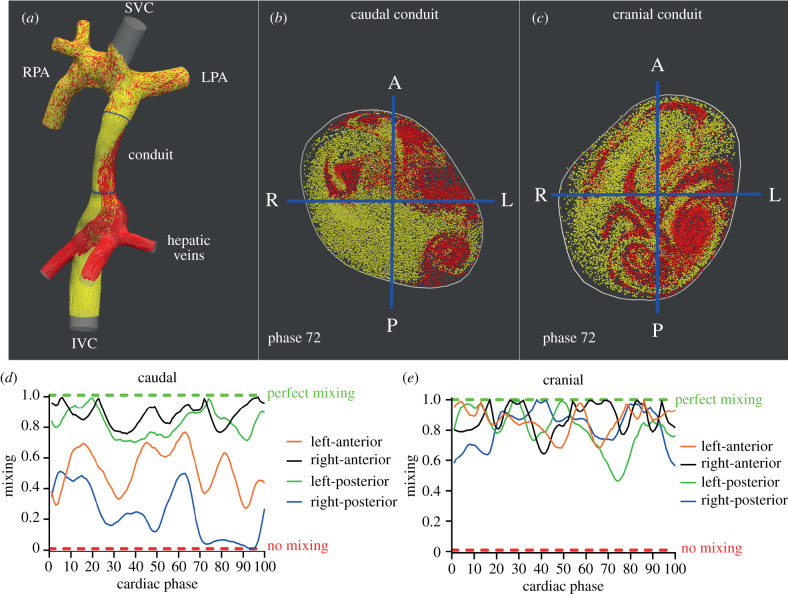
(a) Pathlines originating from the hepatic veins (HV, red) and inferior vena cava (IVC, yellow) are shown within the TCPC of a typical extracardiac conduit Fontan patient. Positions of the caudal and cranial cross-sections with the Fontan conduit are shown (blue). Of note, no pathlines were generated from the superior vena cava to allow for better visualization of the HV and IVC flow. (b,c) Transections with HV and IVC pathlines are shown for the caudal (b) and cranial (c) cross-sections for phase 72/100 of the cardiac cycle. The division into four subsections is indicated by blue lines. Note how an evidently non-uniform distribution of HV flow is present, most strikingly at the caudal part of the conduit, with almost no HV flow present in the right-posterior subsection. (d,e) Time-resolved mixing characteristics of HV and IVC flows are shown for the caudal and cranial cross-section of the conduit. At the caudal conduit, a relatively good mixing is present in the right-anterior and left-posterior subsections, with reduced mixing in the left-anterior and right-posterior segments. Note how almost no mixing is present at phase 72 in the right-posterior segment, consistent with the absence of HV flow in this subsection (b). (e) Significantly better mixing is present at the cranial part of the conduit, illustrated by a more uniform distribution of IVC and HV flow streams over the cross-section. SVC/IVC, superior/inferior vena cava; LPA/RPA, left/right pulmonary artery; A, anterior; P, posterior; L/R, left/right.

