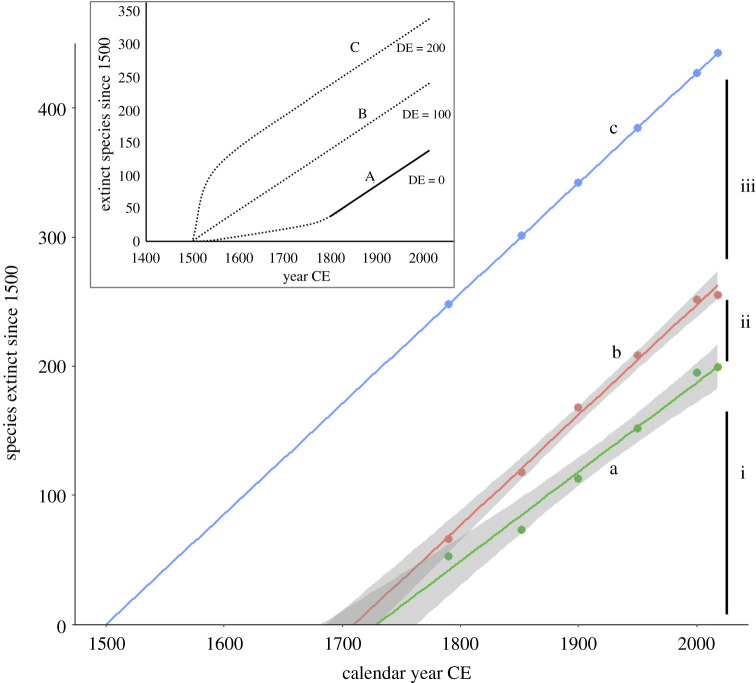
Figure 2.
‘Extinction diagram’ for birds 1500–present: plots of cumulative extinction of birds since 1500 against time (calendar year, CE), showing the effect of DE. (line a) The lowest line shows the cumulative extinctions from 1500 to present that we know about (E = 199), plotted over the time period (1800–present) for which the data are most credible. This line has an intercept at 1728. (line b) The middle line shows the addition of DE estimated for the taxonomic period by the program seux (increment ii, approximately 56). This line has an intercept at 1710. (line c) Adding an additional 180 extinct species (increment iii) to the numbers (pre-taxonomic DE = 180) gives an intercept at 1500 (see the text). Here, the points are shown on the line to indicate that this is not a new regression but simply an upward displacement of the line below. Inset: Conceptual models of pre-1800 extinction. (line A) Slow-start model (no DE): this is equivalent to the actual known extinctions post-1500. Solid line: post-1800 known extinction; dotted line: pre-1800 with no DE (rather few extinctions are known from this period). (line B) Constant extinction (linear) model. Cumulative post-1500 extinction curve with the addition of pre-1800 DE (pre-1800 DE = 100). (line C) Filter model (see the text): high early DE filters out susceptible species (pre-1800 DE = 200).

