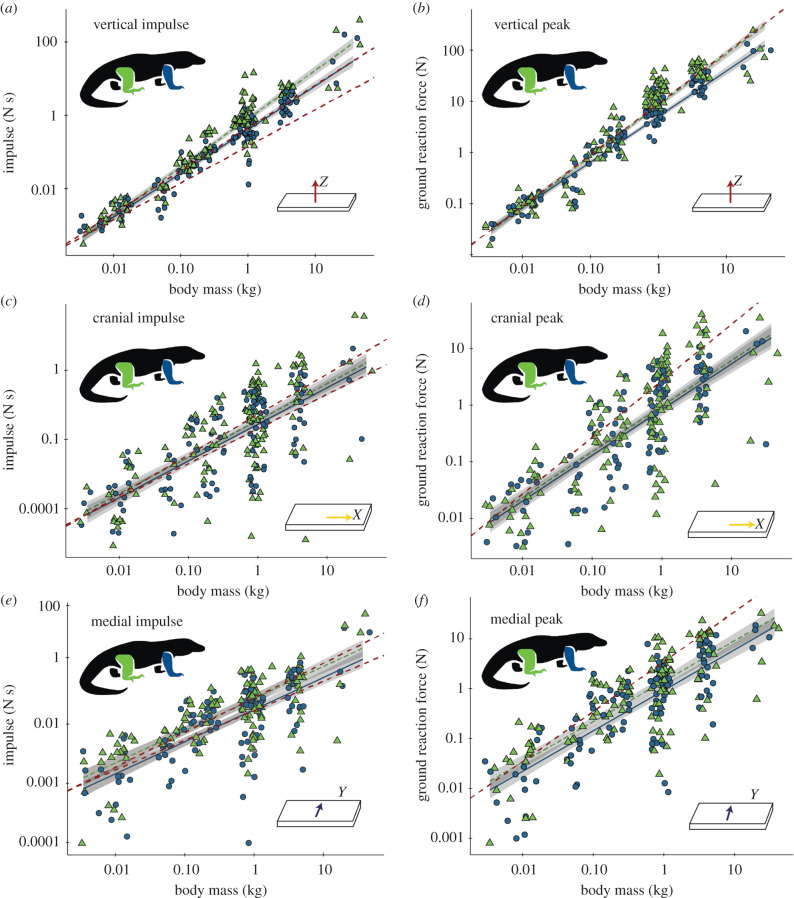
Figure 2.
Scaling of ground reaction impulse and peak force in monitor lizards. Impulse and peak forces for vertical (a,b), caudal (c,d) and lateral (e,f) directions shown on log-log plots with regression lines from mixed-effects models for the hindlimbs (green triangles) and the forelimbs (blue circles). Regression equations are listed in table 2. Red dashed lines indicate slopes of 1 (peak graphs), and 1 and 1.167 (impulse graphs). Shading indicates 95% confidence intervals.

