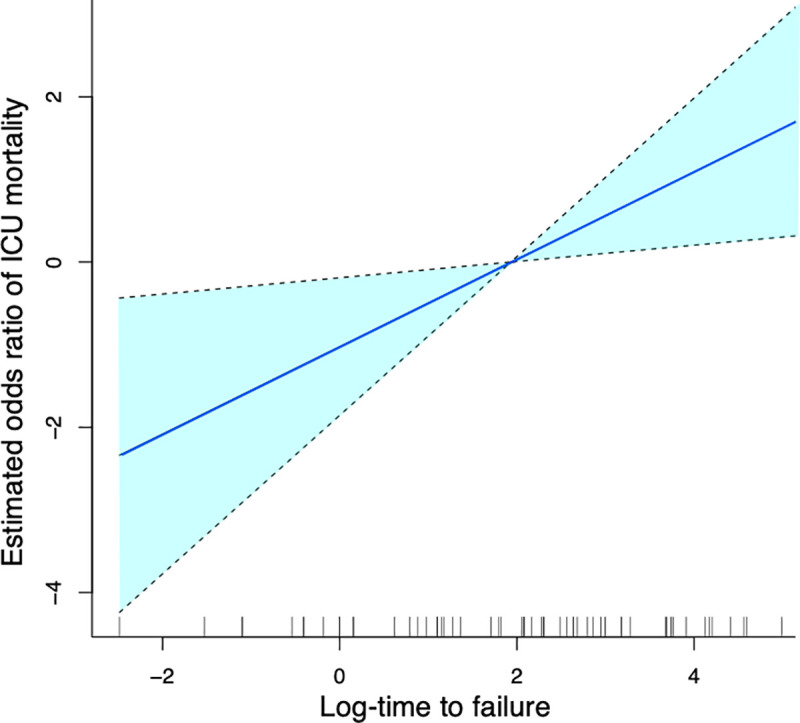
Fig 3. Spline curve in log odds ratio on the effect of log-time to failure on ICU mortality.

Spline curve was plotted by using 3 adjusting factors (age, SOFA score, and PaCO2 before intubation). Dotted line means 95% confidence interval.

Spline curve was plotted by using 3 adjusting factors (age, SOFA score, and PaCO2 before intubation). Dotted line means 95% confidence interval.