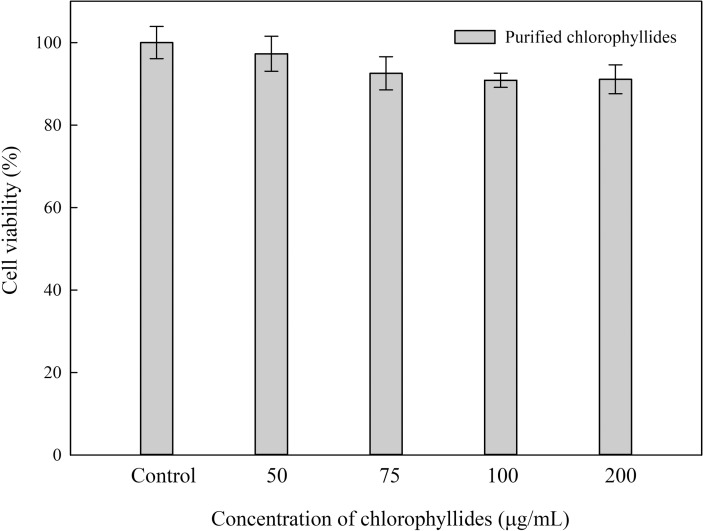
Fig 3. MTT assay of chlorophyllides in NIH/3T3 cells.
The results showed that when the concentration was 200 μg/mL, there is no statistical difference between the control group (chlorophyllides absent). Data representing mean ±SE from five independent replicates was subjected to further statistical analysis by one way ANOVA using SigmaPlot Version 14.0. One-way ANOVA for this experiment returns p = 0.511.

