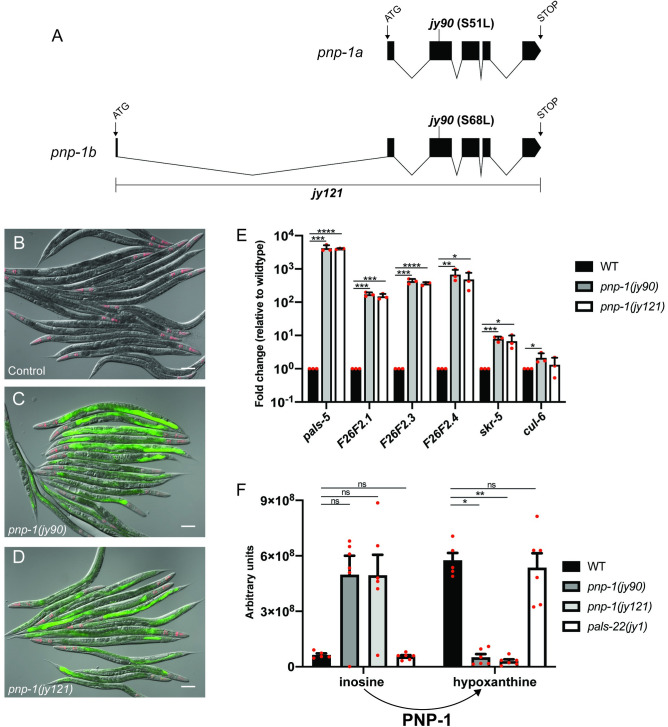
Fig 1. pnp-1 mutants have increased expression of IPR genes.
A) Gene structure of the two isoforms of pnp-1 with exons indicated as black boxes. 5’ and 3’ untranslated regions are not shown. B-D) pals-5p::gfp IPR reporter expression in wild-type animals, pnp-1(jy90) and pnp-1(jy121) mutants. myo-2p::mCherry is a pharyngeal marker for the presence of the IPR reporter transgene. Scale bar is 100 μm. E) qRT-PCR of a subset of IPR genes in pnp-1(jy90) and pnp-1(jy121) mutants. Fold change in gene expression is shown relative to wild-type animals. Graph shows the mean fold change of three independent experiments. Error bars are standard deviation (SD). Mixed stage populations of animals were used. **** indicates p < 0.0001 by one-tailed t-test. F) Quantification of inosine and hypoxanthine levels in pnp-1 and pals-22 mutants from metabolomics analysis. Graph shows the mean levels of metabolites from six independent experiments for pnp-1(jy121), pnp-1(jy90) and pals-22(jy1) mutants, and five independent experiments for wild-type animals. Error bars are standard error of the mean (SEM). ** indicates p < 0.01 by the Kruskal-Wallis test. E, F) Red dots indicate values from individual experiments. See materials and methods for more information.

