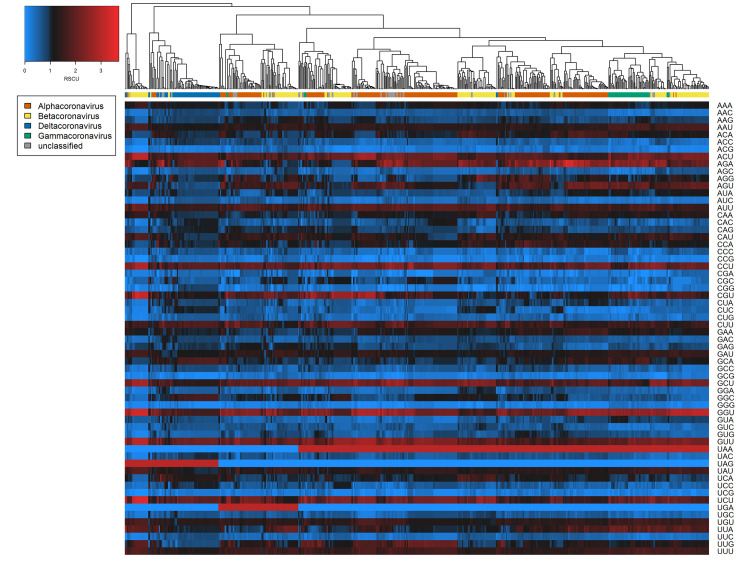
Fig 1. Codon biases (RSCU) across coronavirus spike protein sequences examined.
Heatmaps of coronavirus codon usage bias (RSCU) associated with each codon in each spike protein sequence (n = 650). Main colour scale denotes RSCU value, a null value of 1 (black) indicating no difference in codon usage from expectation, with blue and red representing under- or overrepresentation respectively. Dendrogram colour bar denotes taxonomic genus.

