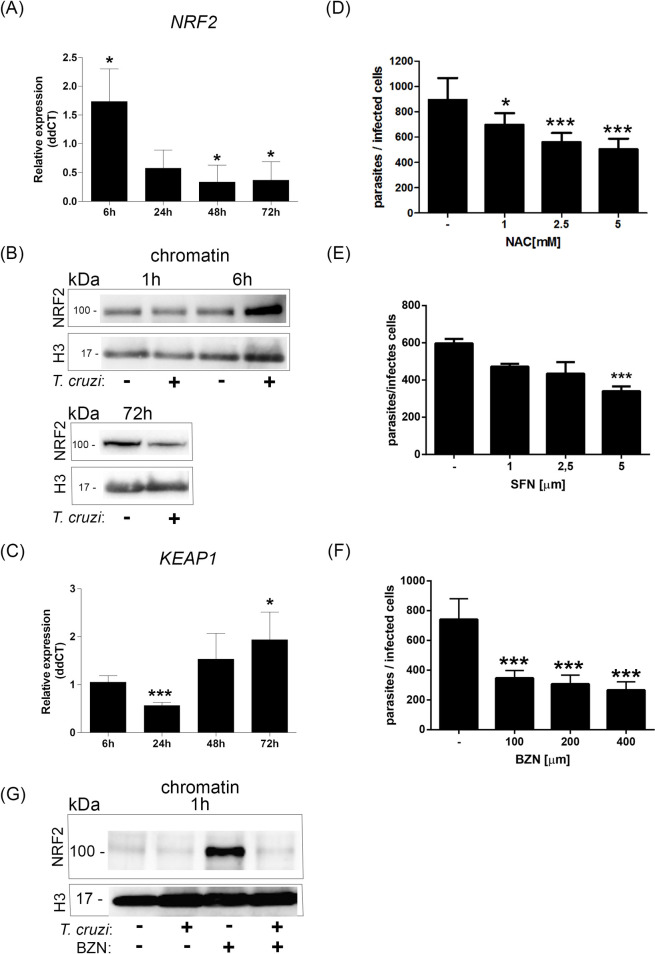
Fig 4. Early NRF2 activation is not sustained during infection.
(A) Relative expression (ddCT) from gene NRF2 from infected cells compared to control 6 h, 24 h, 48 h, and 72 h post-infection (p.i.). ACTB gene was used as the endogenous control. The bar graph represents the mean and standard deviation of mRNA relative expression of infected cells compared to the control; *p<0.05. (B) Isolated chromatin from infected (+) or control cells (-) 1 h, 6 h, or 72 h p.i. were immunoblotted with anti-NRF2. The loading control was assessed by anti-histone 3 (H3). (C) Gene KEAP1 ddCT from infected cells compared to control 6 h, 24 h, 48 h, and 72 h p.i. ACTB gene was used as the endogenous control. The bar graph represents the mean and standard deviation of the mRNA relative expression of infected cells compared to the control; *p<0.05;***p<0.001. HeLa cells were infected with T. cruzi (MOI:20:1). After infection, cells were incubated with (D) N-Acetyl-L-cysteine (NAC; 1 mM, 2.5 mM, and 5 mM), (E) Sulforaphane (SFN; 1μM, 2.5 μM, and 5 μM), or (F) Benznidazole (BNZ; 100 μm, 200 μm and 400 μm). After 48 h, cells were fixed and stained. Parasites from 100 infected cells were counted per experiment. Three independent experiments were performed in duplicate or triplicate. *p<0.05; ***p<0.001. (G) Isolated chromatins from infected cells or not that were pretreated or not with BNZ (200μm) were immunoblotted with anti-NRF2. Histone 3 was used as a loading control.

